Understanding Regression Analysis and ANOVA: Key Concepts for Data Evaluation
This comprehensive guide covers the foundational aspects of regression analysis, including multiple linear regression, logistic regression, and ANOVA (Analysis of Variance). It outlines how to model relationships between dependent and independent variables, interpret coefficients, and evaluate hypotheses using t-tests. Key insights into main effects, interactions, and model efficacy (R²) are provided. The material offers practical commands for statistical software applications, ensuring a solid understanding of statistical modeling techniques and their applications in real-world scenarios.

Understanding Regression Analysis and ANOVA: Key Concepts for Data Evaluation
E N D
Presentation Transcript
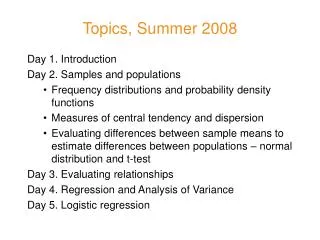
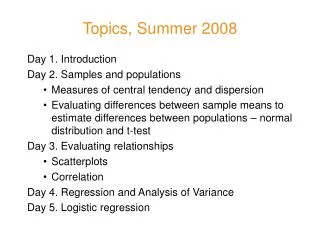
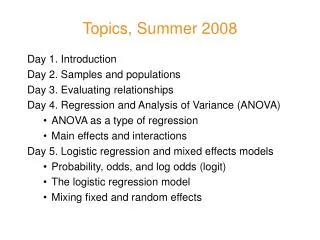
Topics, Summer 2008 Day 1. Introduction Day 2. Samples and populations Day 3. Evaluating relationships Day 4. Regression and Analysis of Variance (ANOVA) • ANOVA as a type of regression • Main effects and interactions Day 5. Logistic regression and mixed effects models • Probability, odds, and log odds (logit) • The logistic regression model • Mixing fixed and random effects
Regression • Linear model • designates one of variables as the dependent variable whose variation is being predicted • other variables then are independent variables which are added together to predict variation • Components of multiple linear regression • intercept (if included) models the expected value when all independent variables are set to 0 • use t-test to evaluate hypothesis that coefficient for each independent variable different from 0 • R2 measures proportion of variation accounted for by the model as a whole
Regression and ANOVA • Multiple linear regression • use lm(y~x1+x2+…+xq) command to model: ŷ = b0 + b1x1 + b2x2 + … + bqxq • Analysis of Variance (ANOVA) is a family of subtypes of linear regression where: • all of the independent (predictor) variables are nominal variables (factors) • use F-test to evaluate all levels of factor together • R2 measures efficacy of model as (as in other linear regression models) • use anova(lm(y~x1+…+xq)) or aov(y~x1+ … +xq)
Logistic regression • dependent variable is a nominal variable that can take one of two values, such as: • [i:] or [I] in Hillenbrand et al. (1995) dataset • NP or VP in Bresnan et al. (2007) dataset • Probability if only one independent variable: p(y) = p(y|x1)*p(x1) • can be made into linear model using logit • odds of observation value: p / (1-p) • log odds: ln(p / (1-p) ) logit(y) = b0 + b1x1 + b2x2 + … + bqxq