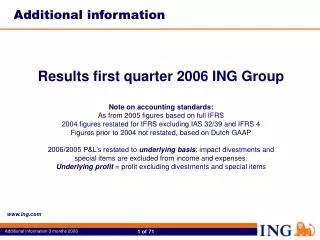
Additional information
Additional information. Results 12 months 2005 ING Group. Note on accounting standards: 2005 figures based on full IFRS 2004 figures restated for IFRS excluding IAS 32/39 and IFRS 4 Figures prior to 2004 not restated, based on Dutch GAAP

Additional information
E N D
Presentation Transcript
Additional information Results 12 months 2005 ING Group Note on accounting standards: 2005 figures based on full IFRS 2004 figures restated for IFRS excluding IAS 32/39 and IFRS 4 Figures prior to 2004 not restated, based on Dutch GAAP Underlying profit = profit excluding divestments and special items www.ing.com
Contents (1) ING Group general Underlying profit before tax 5 of 77P&L ING Group, 12 months 6 of 77 Profit before tax and underlying profit before tax 7 of 77 Profit before tax and underlying profit before tax 8 of 77 Net profit and underlying net profit 9 of 77 Net profit and underlying net profit 10 of 77 Insurance, pre tax impact of divestments and special items 11 of 77 Banking, pre tax impact of divestments and special items 12 of 77 Insurance, net profit impact of divestments and special items 13 of 77 Banking, net profit impact of divestments and special items 14 of 77 P&L Insurance Europe 15 of 77 P&L Insurance Americas 16 of 77 P&L Insurance Asia/Pacific 17 of 77 P&L Wholesale Banking 18 of 77 P&L Retail Banking 19 of 77 P&L ING Direct 20 of 77 Insurance Europe, impact divestments and special items 21 of 77 Insurance Americas, impact divestments and special items 22 of 77 Insurance Asia/Pacific, impact divestments and special items 23 of 77 Wholesale Banking, impact divestments and special items 24 of 77 Retail Banking, impact divestment and special items 25 of 77 Business lines: income and profit before tax 26 of 77 Operating expenses 27 of 77 Tax and tax ratio 28 of 77
Contents (2) Information on capital29 of 77 Balance sheet ING Group 30 of 77 The composition of ING’s capital base 31 of 77 Information on capital and solvency 32 of 77 Financial leverage ING Group and ING Insurance 33 of 77 Capital Position ING Insurance 34 of 77 Insurance: capital and reserves per region 35 of 77 Capital position ING Bank 36 of 77 ING Group insurance operations 37 of 77 Premium income, 12 months 2005 38 of 77 Profit before tax 39 of 77 Developing markets 40 of 77 Developing markets 41 of 77 New business information, 12 months 2005 42 of 77 New business information, 12 months 2004 43 of 77 Non-life operations by class of business 44 of 77 Profit non-life insurance by class of business 45 of 77 Ratios non-life 46 of 77 ING Insurance Investments by product type 47 of 77 Fixed income securities by rating class 48 -51 of 77 Balance sheet ING Verzekeringen N.V. 52 of 77
Contents (3) ING Group banking operations Income banking operations 54 of 77 Banking: Underlying Profit before tax 55 of 77 Banking: development interest margin 56 of 77 RAROC and Economic capital 57 of 77 Cost/income ratio 58 of 77 Risk costs ratio (in bps of average CRWA) 59 of 77 Value at Risk trading and treasury positions 2005 60 of 77 Loans and advances to customers of the banking operations 61 of 77 Loan portfolio ratios 62 of 77 Balance sheet ING Bank N.V. 63 of 77 ING Direct 64 - 72 of 77 Pensions 73 - 76 of 77 Disclaimer 77 of 77
Underlying Profit before tax, 2005 Insurance Asia/Pacific 14% Life 32% Bank 53% Insurance Europe 50% Insurance Americas 36% Non-life 15% Life (excl. Other) Total ING Direct 13% Insurance Europe 34% WholesaleBanking 48% Insurance Americas 66% RetailBanking 39% Banking (excl. Other) Non-life (excl. Other)
P&L ING Group, 12 months Insurance Banking Total* % 2005 2004 2005 2004 2005 2004 change Premium income Investment income Interest result banking operations Commission income Other income Total income Underwriting expenditure Other interest expenses Operating expenses Impairments/additions to the provision for loan losses Total expenditure Profit before tax Taxation Third-party interests Net profit * including inter company eliminations 937 9,162 2,401 1,348 13,848 363 8,699 2,581 1,035 12,678 45,758 9,944 1,346 376 57,424 43,617 10,179 1,198 608 55,602 45,758 10,845 9,067 3,747 1,724 71,141 43,617 10,379 8,741 3,779 1,643 68,159 5 4 4 -1 5 4 8,844 88 8,932 8,795 465 9,260 47,120 1,100 5,195 31 53,446 45,384 1,140 4,746 10 51,280 47,120 969 14,039 119 62,247 45,384 1,019 13,541 475 60,419 4 -5 4 -75 3 3,978 455 255 3,268 4,322 850 123 3,349 8,894 1,379 305 7,210 7,740 1,709 276 5,755 15 -19 11 25 4,916 924 50 3,942 3,418 859 153 2,406
Insurance, net profit impact of divestments and special items
P&L Insurance Europe 2005 2004 Q4 2,651 1,096 253 4,000 2,837 111 477 14 3,439 561 561 561 Q3 2,478 1,211 111 3,800 2,728 134 472 1 3,335 465 465 465 Q2 2,421 1,219 114 3,754 2,678 118 467 1 3,264 490 490 490 Q1 3,152 1,057 282 4,491 3,401 118 454 3 3,976 515 10 505 505 Q4 2,661 1,068 179 3,908 2,916 92 542 -7 3,543 365 365 365 Q3 2,662 985 121 3,768 2,920 62 397 -8 3,371 397 397 397 Q2 2,504 1,144 71 3,719 2,703 71 429 7 3,210 509 509 498 Q1 3,542 975 129 4,646 3,788 97 400 9 4,294 352 352 352 Premium income Income from investments Commission and other income Total income Underwriting expenditure Other interest expenses Operating expenses Investment losses Total expenditure Profit before tax (PBT) Gains / losses on divestments PBT from divested units PBT excluding divestments Underlying PBT
P&L Insurance Americas 2004 2005 Q4 5,875 1,042 127 7,044 6,045 -82 666 1 6,630 414 -10 424 424 Q3 5,997 1,168 507 7,672 6,346 131 602 5 7,084 588 19 569 569 Q2 5,675 1,148 -3 6,820 5,794 -24 577 -3 6,344 476 -78 5 549 549 Q1 5,197 1,029 274 6,500 5,412 73 552 6,037 463 19 7 437 437 Q4 5,412 1,407 204 7,023 5,658 58 584 12 6,312 711 254 40 417 417 Q3 5,819 1,033 197 7,049 6,326 20 538 1 6,885 164 -252 21 395 395 Q2 5,786 1,056 226 7,068 6,031 14 551 -1 6,595 473 12 461 461 Q1 5,744 1,006 194 6,944 6,043 26 529 2 6,600 344 16 328 328 Premium income Income from investments Commission and other income Total income Underwriting expenditure Other interest expenses Operating expenses Investment losses Total expenditure Profit before tax (PBT) Gains / losses on divestments PBT from divested units PBT excluding divestments Underlying PBT
P&L Insurance Asia/Pacific 2005 2004 Q4 3,158 266 -41 3,383 2,992 2 243 7 3,244 139 27 112 112 Q3 2,961 255 -63 3,153 2,802 3 233 1 3,039 114 1 113 113 Q2 3,357 210 46 3,613 3,347 2 210 3,559 54 2 52 52 Q1 2,810 194 46 3,050 2,697 1 181 2,879 171 1 170 170 Q4 2,795 186 1 2,982 2,649 2 210 -4 2,857 125 5 120 120 Q3 2,371 203 19 2,593 2,308 0 189 2 2,499 94 -1 95 95 Q2 2,227 391 34 2,652 2,091 2 155 -1 2,247 405 219 36 150 150 Q1 2,076 164 23 2,263 1,955 4 173 -1 2,131 132 22 110 110 Premium income Income from investments Commission and other income Total income Underwriting expenditure Other interest expenses Operating expenses Investment losses Total expenditure Profit before tax (PBT) Gains / losses on divestments PBT from divested units PBT excluding divestments Underlying PBT
P&L Wholesale Banking 2005 2004 Q2 636 243 575 1,454 920 534 6 528 47 481 481 Q1 701 302 787 1,790 848 942 -82 1,024 285 14 725 725 Q4 807 310 192 1,309 967 342 19 323 -169 -4 496 537 Q3 797 329 334 1,460 898 562 34 528 87 -30 471 471 Q2 822 322 282 1,426 932 494 68 426 3 423 423 Q1 846 402 428 1,676 937 739 71 668 -84 91 661 661 Q4 755 327 283 1,365 882 483 -11 494 0 -8 502 502 Q3 836 327 185 1,348 816 532 -21 553 -15 568 568 Interest result Commission income Other income Total income Operating expenses Gross result Addition to the provision for loan losses Profit before tax (PBT) Gains / losses on divestments PBT from divested units PBT excluding divestments Underlying PBT
P&L Retail Banking 2005 2004 Q4 1,125 272 59 1,456 925 531 25 506 506 506 Q3 1,125 283 100 1,508 1,001 507 6 501 501 501 Q2 1,102 271 35 1,408 976 432 18 414 414 414 Q1 1,045 272 107 1,424 927 497 41 456 62 394 394 Q4 995 260 38 1,293 1,054 239 64 175 1 174 174 Q3 998 292 7 1,297 906 391 39 352 2 350 350 Q2 982 304 -29 1,257 903 354 36 318 -1 319 319 Q1 953 281 -19 1,215 840 375 45 330 5 325 325 Interest result Commission income Other income Total income Operating expenses Gross result Addition to the provision for loan losses Profit before tax (PBT) Gains / losses on divestments PBT from divested units PBT excluding divestments Underlying PBT
P&L ING Direct 2005 2004 Q2 432 24 41 497 344 153 26 127 127 127 Q1 452 22 13 487 323 164 37 127 127 127 Q4 547 28 0 575 379 196 12 184 184 184 Q3 516 30 14 560 350 210 31 179 179 179 Q4 431 22 10 463 329 134 16 118 118 118 Q3 430 16 3 449 307 142 28 114 114 114 Q2 396 26 3 425 276 149 24 125 125 125 Q1 351 18 3 372 273 99 21 78 78 78 Interest result Commission income Other income Total income Operating expenses Gross result Addition to the provision for loan losses Profit before tax (PBT) PBT excluding divestments Underlying PBT
Insurance Asia/Pacific, impact divestments and special items
Business lines: income and profit before tax 12 months 2005 2004 % Q4 2005 2004 % Insurance Europe Insurance Americas Insurance Asia/Pacific Wholesale Banking Retail Banking ING Direct Corporate line Total income Insurance Europe Insurance Americas Insurance Asia/Pacific Wholesale Banking Retail Banking ING Direct Corporate line Total profit before tax 16,045 28,036 13,199 5,957 5,796 2,119 -11 71,141 2,031 1,941 478 2,599 1,877 617 -649 8,894 16,041 28,084 10,490 5,871 5,062 1,709 902 68,159 1,623 1,692 756 1,945 1,175 435 114 7,740 0 0 26 1 15 24 4 25 15 -37 34 60 42 15 4,000 7,044 3,383 1,365 1,456 575 130 17,953 561 414 139 494 506 184 -139 2,159 3,908 7,023 2,982 1,309 1,293 463 206 17,184 365 711 125 323 175 118 53 1,870 2 0 13 4 13 24 4 54 -42 11 53 189 56 15
Operatingexpenses • Personnel expenses • - insurance operations • - banking operations • Other expenses • - insurance operations • - banking operations • Total operating expenses • - insurance operations • - banking operations (12 months) 2005 2004 % 2,901 4,745 7,646 2,294 4,099 6,393 5,195 8,844 14,039 2,686 4,950 7,636 2,060 3,845 5,905 4,746 8,795 13,541 8 -4 0 11 7 8 9 1 4
Tax and tax ratio Tax Insurance operations Banking operations Total (12 months) 2005 2004 850 859 1,709 19.7 25.1 22.1 455 924 1,379 11.4 18.8 15.5 Tax ratio in %: Insurance operations Banking operations Total
Balance sheet ING Group 31 December 1 January 2005 2005 % Assets Cash and balances with central banks Amounts due from banks Non-trading derivatives Financial assets at fair value through P&L Investments Loans and advances to customers Reinsurance contracts Property and equipment Other assets Total Capital and reserves Third-party interests Total equity Liabilities Preference shares Subordinated loans Insurance and investment contracts Amounts due to banks Customer deposits and other funds on deposit Debt securities in issue/other borrowed funds Financial liabilities at fair value through P&L Non-trading derivatives Other liabilities Total liabilities Total equity and liabilities 13,084 47,466 7,766 260,378 322,712 439,181 8,285 5,757 54,010 1,158,639 36,736 1,689 38,425 296 6,096 263,487 122,234 465,712 113,541 103,620 6,248 38,980 1,120,214 1,158,639 9,805 48,914 9,103 205,101 265,602 371,919 6,818 5,783 41,410 964,455 28,172 2,095 30,267 296 4,230 218,360 90,444 395,348 107,245 79,398 8,701 30,166 934,188 964,455 33 -3 -15 27 22 18 22 0 30 20 30 -19 27 44 21 35 18 6 31 -28 29 20 20
The composition of ING’s capital base Group Insurance Bank 31 December 2005 Capital and reserves Group hybrid capital (1) Core debt Other (2) Total capitalisation Prudential filter (re volatile parts of IFRS) Insurance hybrid capital Minorities Other Regulatory capital Other qualifying capital DAC/VIF adjustment Double gearing Adjusted equity / capital base 36,736 7,883 3,964 -151 48,432 -5,978 - 3,964 38,490 20,627 1,823 -178 22,272 -2,844 2,229 1,227 22,884 4,503 27,387 21,331 5,764 -1,205 25,889 -3,134 652 23,408 11,318 34,726 (1) Group hybrids exceed hybrids Bank + Insurance (mainly due to preference shares). (2) Goodwill +revaluation of shares and real estate at ING Bank.
Information on capital and solvency EXPLANATIONS OF ING’s capital base. • Capital and reserves represent accounting capital (B/S item) • Group hybrid capital consists of all tier-1 instruments issued by the Group (e.g. perpetual debt securities and preference shares); • All Group hybrid tier-1 instruments other than the preference shares, are downstreamed to Insurance and/or Bank on a mirrored basis; • Group core debt equals investments minus equity of the Group holding company. This net debt position is used by the Group as equity for Insurance and Bank and is numerator of the Group D/E ratio. (D/E ratio = (core debt) / (adjusted equity + core debt)); • To calculate regulatory capital, ING deducts the entire revaluation reserve (IFRS prudential filter). The banking regulator requires this deduction to be made from tier-1 capital, and ING applies this method to Bank, Insurance and Group. Regulatory capital for the bank is Tier I capital; • To calculate adjusted equity for Insurance, deduct 50% of the deferred acquisition costs (DAC) and add 50% of the value in force (ViF). Adjusted equity is the basis for calculating the leverage ratio’s of Insurance; • Internally, ING manages and allocates capital on the basis of economic capital (EC).
Financial leverage ING Group and ING Insurance D/E = (core debt) / (adjusted equity + core debt)
Insurance: capital and reserves per region 31 December 2005 Capital and reserves Netherlands Belgium USA Canada Mexico Australia Taiwan Other Total 10,166 906 4,515 1,524 955 1,252 1,293 16 20,627
ING GAAP IFRS Year end Capital position Q2 Q3 Q4 Jan. 1st Q1 2001 2004 2005 2002 2003 2005 2005 2005 2005 13,959 Core capital 13,941 14,000 14,435 16,114 15,569 16,633 17,644 16,923 (excl. hybrids) 5,025 Core capital funded 3,142 4,080 4,639 5,025 5,166 5,367 5,764 5,698 by Group hybrids 18,984 Tier-1 capital 17,083 18,080 19,074 21,139 20,735 22,000 23,408 22,621 9,678 Other capital 8,628 9,071 9,408 10,294 10,181 10,241 11,318 11,383 28,662 Qualifying capital 25,711 27,151 28,482 31,433 30,916 32,241 34,726 34,004 274,138 RWAs 243,174 247,287 251,266 274,138 287,398 305,543 319,653 313,905 6.92% Tier-1 ratio 7.03% 7.31% 7.59% 7.71% 7.21% 7.20% 7.32% 7.21% 10.46% BIS ratio 10.57% 10.98% 11.34% 11.47% 10.76% 10.55% 10.86% 10.83% Capital position ING Bank
Profit before tax The Netherlands Belgium Centra Europe & Spain Insurance Europe North America Latin America Insurance Americas Asia Australia Insurance Asia/Pacific Other Total (12 months 2005) Life % Non-life % 35 129 -36 39 -5 -42 -9 100 -100 -98 -72 -22 20 3 49 22 50 -4 43 -12 18 -2 1 369 48 7 424 775 58 833 6 0 6 49 1,312 1,230 126 251 1,607 1,007 101 1,108 272 200 472 -521 2,666
Developing markets (12 months) Premium Profit before tax Europe Latin America Asia Total Asia excl. Taiwan Total excl. Taiwan 2005 2004 % 2005 2004 % 22 -3 26 17 1,045 2,019 5,762 8,826 857 2,083 4,588 7,528 211 154 211 575 211 575 156 202 228 586 140 497 35 -24 -7 -2 52 16
Developing markets Poland Czech Republic Slovakia Hungary Romania Bulgaria Russia Mexico Brazil Chile Peru Latin America Corporate South Korea Taiwan China Hong Kong India Malaysia Thailand Total Total excl. Taiwan Premium Profit before tax (12 months) 2005 2004 2005 2004 62 37 2 51 6 -1 -2 122 13 45 23 0 119 89 -4 14 -18 33 -4 586 497 200 258 57 267 75 0 0 1,551 0 532 0 0 1,598 2,348 36 232 27 313 35 7,528 234 298 64 341 107 0 0 1,424 0 594 0 0 2,278 2,707 46 256 67 358 49 8,826 107 41 -5 61 10 -2 -1 105 6 24 23 -4 181 0 -3 22 -20 35 -4 575 575
New business information, 12 months 2005 • Annual Premium Equivalent = 100% of Annual plus 10% of Single • Value of New Business • New Business Margin (Defined as (VNB / APE) * 100%.)
New business information, 12 months 2004 • Annual Premium Equivalent = 100% of Annual plus 10% of Single • Value of New Business • New Business Margin (Defined as (VNB /APE) * 100%.)
Non-life operations by class of business (12 months) Premium income Profit before tax 2005 2004 2005 2004 Fire Marine & Aviation Motor Health Income/Accident Miscellaneous Indirect business Total 1,503 109 2,371 1,154 780 640 57 6,614 1,490 141 2,175 1,097 872 818 50 6,642 101 11 652 92 268 163 25 1,312 175 10 509 76 287 519 99 1,675
Profit non-life insurance by class of business (12 months 2005) Fire M.& A. Motor Health Acc. Misc. Indirect Total 36 17 2 64 2 1 -21 101 2 4 4 1 11 13 11 4 567 46 2 9 652 6 7 81 -2 92 248 17 2 1 268 51 -4 -1 55 8 54 163 13 4 1 7 25 369 48 7 775 58 6 49 1,312 The Netherlands Belgium Central Eur./Spain North America Latin America Asia Other Total
Ratios non-life Claims ratio Expense ratio Combined ratio (12 months) The Netherlands Belgium Central Europe/Spain USA Canada Latin America Asia Australia Total 2005 2004 2005 2004 2005 2004 56% 67% 51% 80% 56% 76% 53% 63% 60% 71% 46% 84% 56% 72% 57% 46% 63% 39% 34% 42% 24% 31% 28% 40% 32% 37% 37% 36% 22% 29% 27% 41% 28% 31% 95% 101% 93% 104% 87% 104% 93% 95% 97% 108% 82% 106% 85% 99% 98% 74% 94%
ING Insurance Investments by product type 31 December 2005 Europe Americas Asia/Pacific Total Fixed income: Debentures Private loans Mortgages Policy loans Other Total fixed income Real estate Equities Total 45,000 5,155 17,635 129 1,038 68,957 3,597 9,878 82,432 67,076 342 9,746 2,085 773 80,022 368 2,083 82,473 18,114 27 668 1,322 1,169 21,300 77 1,952 23,329 130,190 5,524 28,049 3,536 2,980 170,279 4,042 13,913 188,234 Note: table includes general account portfolios only
Fixed income securities by rating class Total ING Insurance 31 December 2005 • AAA 34% • AA 19% • A 28% • BBB 16% • BB 2% • Rest 1% Table does not include unrated securities, mortgages, policy loans and “other” fixed income investments Note: table includes general account portfolios only
Fixed income securities by rating class Insurance Europe 31 December 2005 • AAA 42% • AA 25% • A 24% • BBB 7% • BB 1% • Rest 1% Table does not include unrated securities, mortgages, policy loans and “other” fixed income investments Note: table includes general account portfolios only
Fixed income securities by rating class Insurance Americas 31 December 2005 • AAA 34% • AA 10% • A 28% • BBB 24% • BB 3% • Rest 1% Table does not include unrated securities, mortgages, policy loans and “other” fixed income investments Note: table includes general account portfolios only