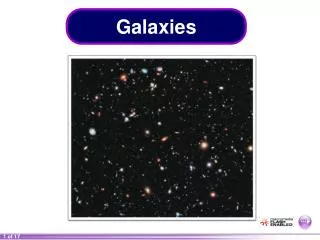
Galaxies
This article explores Edwin Hubble's galaxy classification system, which categorizes galaxies based on their appearance. The morphological sequence provides insights into galactic structure, formation, and evolution. The Hubble Tuning Fork diagram is used to classify elliptical, lenticular, spiral, barred spiral, and irregular galaxies. The limitations of the Hubble classification scheme are also discussed.

Galaxies
E N D
Presentation Transcript
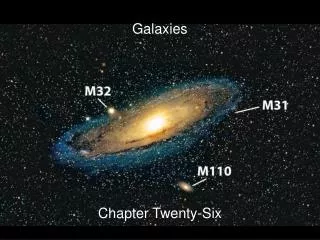
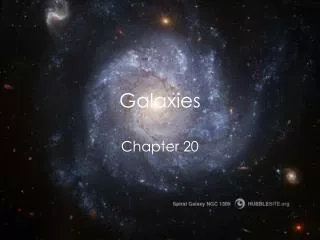
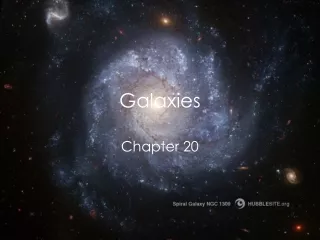
Galaxies Chapter 20
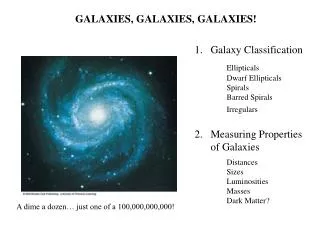
Galaxy Classification In 1924, Edwin Hubble divided galaxies into different “classes” based on their appearance. • Why begin here? • Hubble classification serves as the basic language of the field. • The morphological sequence reflects a fundamental physical and, in some ways, evolutionary sequence, which offers important clues to galactic structure, formation and evolution.
Hubble Tuning Fork diagram (Hubble 1936) Ellipticals Lenticular (S0) Spiral and Barred Spiral Irregular
Spiral Galaxies • Disk + spiral arms + bulge (usually) • Subtype a b c defined by 3 criteria: • Bulge/disk luminosity ratio • Sa: B/D>1 Sc: B/D<0.2 • Spiral pitch angle • Sa: tightly wound arms Sc: loosely wound arms • Degree of resolution into knots, HII regions, etc.
Barred Spiral Galaxies • Contain a linear feature of nearly uniform brightness centered on nucleus • Subclasses follow those of spirals with subtypes a b and c MW may be SBb, depending on prominence of the bar.
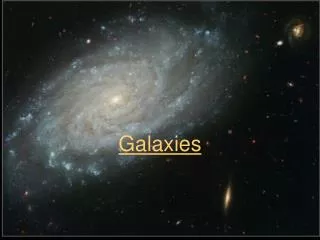
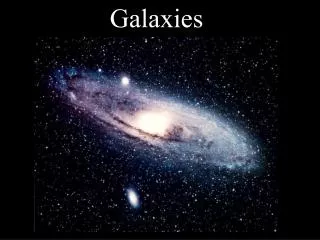
Spiral Galaxies Comprise about 2/3rds of bright galaxies Grand Design Spiral - well defined spiral structure Flocculent - less organized spiral design Spirals clearly contain much gas and dust Most starlight is from young, blue stars - ongoing star formation Sizes - radius = 10 to 30 kpc Masses - M = 107 to 1011 Msun Milky Way and Andromeda are both bright, spirals MV ~ -21 or LV ~ 2 x 10¹⁰ LV,sun
Elliptical Galaxies • Smooth structure and symmetric, elliptical contours • Subtype E0 - E7 defined by flattening • En where n = 10(a-b)/a • a and b are the projected major and minor axes • (not necessarily a good indicator of the true 3-D shape)
NGC 205 Types of Elliptical Galaxies Giant Ellipticals – few 100kpc across, 1 trillion stars MV ~ -23 or LV ~ 1011 LV,sun Dwarf Ellipticals (dE) - as small as 1 kpc across, 1 million stars MV ~ -18 or LV ~ 109 LV,sun • Ellipticals: • contain little or no gas (only ~1% of mass) • no current star formation • mostly older, redder stars - like those in the halo of our galaxy • Unlike halo stars, metal abundances of these stars are high (about twice solar metallicity) Dwarf Spheroidal - Classification dSph Very low stellar density and surface brightness MV ~ -14 or LV ~ 3 x 10⁷ LV,sun Leo I dSph
S0 Galaxies (Lenticulars) • Smooth, central brightness concentration (bulge similar to E) surrounded by a large region of less steeply declining brightness (similar to a disk) • No spiral arm structure but some contain dust and gas • Originally thought to be transition objects between Sa and E but typical S0 is 1-2 mags fainter than typical Sa, E (van den Bergh 1998)
Irregular Galaxies NGC 4485-Irr II M82-Irr II LMC - Irr I • Little morphological symmetry • Lots of young, blue stars and interstellar material • Smaller than most spirals and elliptical galaxies • Two major subtypes: • Irr I: spiral-like but without defined arms, show bright knots with O,B stars • Irr II: contain many dust lanes and gas filaments (e.g. M82) - explosive
General trends within Hubble sequence E Sc: • Decreasing Bulge/Disk • Decreasing stellar age • Increasing fractional gas content • Increasing ongoing star formation • Limitations of the Hubble Classification Scheme • Only includes massive galaxies (doesn’t include dwarf spheroidals, dwarf irregulars, blue compact dwarfs) • Three different parameters for classifying spirals is unsatisfactory because the parameters are not perfectly correlated. • Bars are not all-or-nothing. There is a continuum of bar strengths.
E E+ S0- S0 S0+ Sa Sb Sc Sd Sm Im de Vaucouleurs’ Revised Hubble Classification System (de Vaucouleurs 1958, Handbuch der Phys. 53, 275) (de Vaucouleurs2 1964, Reference Catalog of Bright Galaxies) Basic idea: retain Hubble system, but add lots of additional options: Rings (inner and outer), range of bar-like structures…. Cross section of diagram No Bar Ring shaped Spiral shaped Limitations: Rings and bars are not independent Does not take into consideration mass or other important parameters. Bar
Morphological Distributions • The range and frequency of different morphological types is sensitive to the sample of galaxies studied. Some key results: • The Local Group is the only sample that includes a significant number of very faint galaxies. Of the ~35 galaxies in the Local Group, only the 3 brightest (M31, MW and M33) are spirals, the remainder are equally divided between irregular and dwarf elliptical /spheroidal galaxies. • Within rich clusters of galaxies, the population of bright galaxies is dominated by Ellipticals. • Samples of galaxies outside of clusters (in the “field”) are mainly Spirals. Coma cluster – red=Ellipticals; blue=Spirals; green contours= X-rays
Automated Classification • Visual classification time consuming and different observers may not always agree. This motivates the development of algorithms to automatically and impartially classify galaxy images - very important for large surveys like the Sloan Digital Sky Survey and deep extragalactic fields. • Examples: Abraham et al. (1994, 1996): • Concentration parameter C - fraction of light within ellipsoidal radius 0.3 x outer isophotal radius (1.5 above sky level). • Asymmetry parameter A- fraction of light in features not symmetric wrt a 180 degree rotation
Photometric Properties of Galaxies Astronomers measure brightness in units of magnitude. During the 2nd century BC, Hipparchus ranked all visible stars – brightest were magnitude 1, faintest were magnitude 6. To our eyes, a change of one magnitude = a factor of 2.512 in flux (i.e. logarithmic scale). To convert from flux units (in W/m2 or erg/s/cm2) to magnitudes: mag2 - mag1 = 2.5 log (F1/F2) faintest brightest
15 20 B 25 30 Radius R Photometric Properties of Galaxies To measure the brightness distribution of galaxies, we must determine the surface brightness of the galaxy. • Surface brightness is flux (magnitude) within 1 unit of angular area on the sky (square arc seconds). • (mag/arcsec2) • I is Intensity (W/m2/str) where 1 str = 4.25 x 10¹⁰ arcsec2 R Surface Brightness is independent of distance since flux decreases d2, but the area subtended by 1 square arc second increases as d2.
Surface Brightness profiles for Elliptical Galaxies (and bulges of Spirals) B log I ~ - R 1/4 R1/4 I(R) = Ie exp{-7.67[(R/Re)1/4-1]} “deVaucouleurs law” (1948) or “r1/4 law” Re = effective radius containing 50% of luminosity Re = (aebe)1/2 (factor of 7.67 chosen to make this so) -for major,minor axis Ie = flux at Re Io = Ie103.33 = 2138Ie (central flux)
Spiral Galaxies • Bulges • Luminosity profiles fit r1/4 law • Structure appears similar to Elliptical galaxies, except bulges are more flattened (oblate spheroids). NGC 7331 Sb galaxy R-band isophotes • Disks • log I ~ -R • Most are well-represented by an exponential profile • I(R) = Ioe-R/Rd (Freeman 1970) Central surface brightness Disk scale length
NGC 7331 (Rd) I • Bulge dominates in center and again at very large radii (if bulge obeyed r1/4 to large R) • Disk dominates at intermediate radii • Rd ~ 1 - 10 kpc • Disk in many spirals appear to end at some Rmax around 10 to 30 kpc or (3-5Rd)
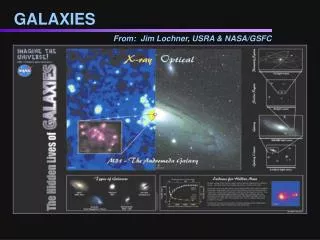
Multi-wavelength view of Galaxies Photons of different energies are created by different physical phenomena. Spiral galaxy M31 (Andromeda) 2 million ly away (700 kpc). 1” on the sky = 3pc HI (neutral H gas) – 21 cm Star formation - Infrared CO (molecular gas) – 3.6 micron Stars & hot gas (optical) • Radio observations allow us to study HI (neutral Hydrogen) and molecular gas • CO displays sharp drop with radius • Traces spiral arms • CO more associated with arms than HI which permeates galaxy (except in center) • Spiral galaxies vary in the amount of molecular to neutral Hydrogen (50% to 10%) • CO velocity map shows rotation
M82 Irregular galaxy X-ray Visible Infrared light produced by recent star formation inside dusty clouds – dust absorbs light and reradiates at longer wavelengths. X-ray emitting gas heated to high temps by supernovae and is expanding in galactic wind. Radio – 21-cm neutral Hydrogen gas Infrared Radio
Spiral Structure The winding dilemma • If spiral arms are coherent physical structures displaying differential rotation like the stars and gas, they would have wound up so tightly by now that they would not be visible. The stars and gas have made dozens of revolutions around the center of their galaxy over the age of the Universe so spiral structure should be “smeared out” if caused due to winding…
Spiral Structure A leading theory for galactic spiral arms is spiral density waves. Density Waves in Traffic
Density Waves in Spiral Galaxies Spiral arms are caused by the compression of gas as it orbits the Galactic center and encounters density waves (moving more slowly). The compression of gas causes stars to form which we see as spiral arms. • Cloud approaches arm at a relative speed of ~100km/s. • Arm acts as gravitational well, slowing down the cloud. • Arm will alter orbits of gas/stars, causing them to move along arm briefly. • Compresses HI gas and gathers small MCs to form GMCs. • GMCs produce O&B stars. • Stellar radiation disrupts the clouds.
Spiral Structure How do density waves form? If stars in the disk of a spiral galaxy are on slightly eccentric orbits, and the position angle of these ellipses vary with radius, a spiral-shaped density wave can be formed from a set of nested ovals. Density wave theory is really based on the premise that mutual gravitational attraction of stars and gas clouds at different radii can offset the spiral’s tendency to wind-up. This produces a pattern which rotates rigidly within the galaxy disk.
Galaxy Spectra Useful information about galaxies can be learned by looking at the spectrum Spectra are dominated by the brightest stars in the galaxy Elliptical galaxy spectra dominated by old, K-type stars. They have strong absorption lines seen in stellar spectra Spiral galaxies have absorption but also bright emission lines from star forming gas regions heated by newly formed stars Kennicutt (1992)
Spiral galaxies – Rotation Curves and Mass Spiral disks seen at inclination i q = cos i where q=b/a (b=semiminor and a=semimajor axis) a b Where vr is radial velocity and vr,0 is radial velocity at galaxy center For M31, vr along the major axis is -30 km/s and central velocity is -270 km/s. Velocity curve is fairly constant out to 36 kpc from center and yields vc ~ 230 km/s.
Evidence of Dark Matter in Spiral Galaxies Rotation curves determined from Doppler shifts in spectral emission lines Vr stays roughly constant with R as far as luminous matter can be detected Masses from 1011 to 2x10¹² Msun 50% to 80% of mass is Dark matter. DM does not have to be confined to the disk – distributed spherically
Elliptical galaxies – Velocity Dispersion and Mass Added width of the absorption lines in elliptical galaxies reveals large random motions of stars – not much rotational motion as observed in spirals. The velocity dispersion σ can be used to estimate the galaxy’s mass. Use Virial Theorem - relation between kinetic and gravitational potential energy for a system in equilibrium K Giant star NGC 2549 S0 galaxy 2K = -U K = ½ M <v2> and U ~ -GM2/r or U = -0.4 GM2/rh where rh is half mass radius Let <v2> = 3σ2 then M = 7.5 σ2rh/G For the dSph Leo I, rh = 290 pc and σ = 8.8 km/s giving M/L ratio of 8 indicates significant DM
Determining Distances to Other Galaxies Cepheid variable stars, when found in other galaxies, tell us the distance to those galaxies since their luminosities can be determined using the period-luminosity relation Cepheids With their high luminosities (~10,000 Lsun), Cepheid variables extend the distance scale to nearby galaxies, out ~25 Mpc (80 million light years).
Determining Distances to Other Galaxies Tully-Fisher Relation (a broadened line) • Galaxy rotation measured via the Doppler shifting of the 21cm atomic hydrogen line. • Rotation speed (width of H line) is proportional to the galaxy’s mass. • Galaxy luminosity is also proportional to galaxy mass (number of stars). • The correlation between luminosity and rotation speed is referred to as the Tully-Fisher relation.
Determining Distances to Other Galaxies Type 1a SN Type-I supernova result from the detonation of white dwarf stars when their mass (slightly) exceeds 1.4 Msun. The brightness of the explosion should be (roughly) the same for every Type-1 supernova. Type-I Supernovae are standard candles. Knowing their luminosity, and comparing to their measured flux, yields the distance via the inverse-square law. Useful for determining distances out to (3 billion light years - 1 Gpc).
Determining Distances to Other Galaxies Hubble’s Law In 1912, Vesto Slipher discovered that with few exceptions, every galaxy is receding from us, i.e. has redshifted spectral lines. Redshift is defined by: z = Dl/l
In the 1920’s, Edwin Hubble discovered that more distant galaxies (using distances determined from Cepheids) are receding faster (have larger redshifts). • The relationship, well fit by a straight line, is called Hubble’s Law. Hubble’s Law is written: Recessional Velocity (in km/sec) = Ho distance (in Mpc) V = Ho D where Ho is Hubble’s constant (slope of the line)
Universal Expansion · You can think of space as the surface of a balloon. As the balloon expands, the space between galaxies stretches. · This means that the wavelength of light emitted by galaxies is also stretched as space expands. The wavelength of light is redshifted – we call this a Cosmological Redshift.
If the rate of expansions stays constant over time, and all objects are together at t=0, current distance between two objects is d = v towhere to is current age of Universe Then, v = (1/to)d Same as Hubble’s law where Ho = 1/to The value 1/Ho is called the Hubble Time age of the Universe if expansion is constant. Ho has units of km/s/Mpc to express velocity and distance in convenient units.
Each distance technique has uncertainties which then add to the error in determining the Hubble Constant Current values hover around Ho = 70 km/s/Mpc with an error of +/- 8 km/s/Mpc
The Cosmic Distance Ladder Hubble’s law allows us to measure distances to the “ends of the visible universe,” (~13 billion light years). It is less accurate for distances < 100 Mpc because of the “peculiar” velocities of galaxies (i.e. motions affected by local gravitational fields).