Download
1 / 43
430 likes | 451 Vues
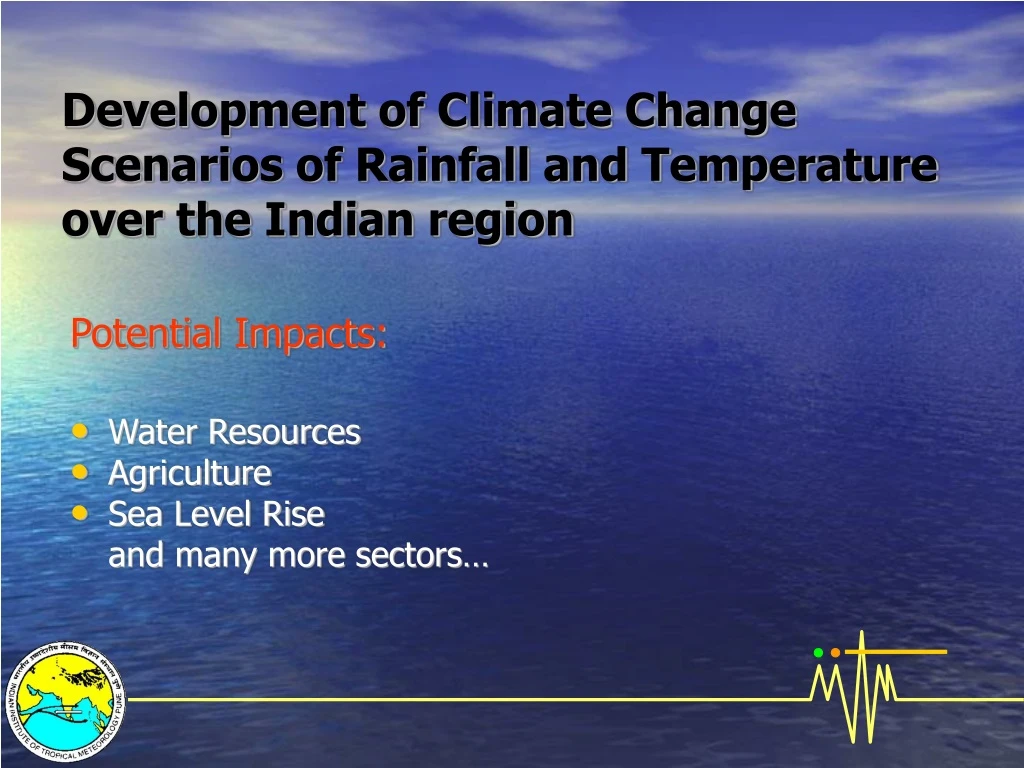
This study explores the potential impacts of climate change on various sectors in the Indian region, including water resources, agriculture, and sea level rise. It examines climate scenarios and uncertainties, climate models, and future projections of rainfall and temperature.

E N D
Development of Climate Change Scenarios of Rainfall and Temperature over the Indian region Potential Impacts: • Water Resources • Agriculture • Sea Level Rise and many more sectors…
Climate Scenarios:What are they ? A climate scenario is a plausible representation of future climate that has been constructed for explicit use in investigating the potential impacts of anthropogenic climate change.
Uncertainties in Climate Scenarios • Specifying alternative emissions futures • Uncertainties in converting emissions to concentrations • Uncertainties in converting concentrations to radiative forcing • Uncertainties in modelling the climate response to a given radiative forcing • Uncertainties in converting model response into inputs for impact studies
Climate Models • Simplified mathematical representation of the Earth’s climate system • Skill depends on the level of our understanding of the physical, geophysical, chemical and biological processes that govern the climate system • Substantial improvements over the last two decades • Sub-models : atmosphere, ocean, land surface, cryosphere, biosphere • Typical Resolution of global models (atmosphere) : Horizontal - 250 km; Vertical ~ 1 km • Small-scale processes : Parameterisation • Coupled models (e.g., atmosphere-ocean) • Sensitivity studies/Future projections • Internal variability/Ensemble runs
Development of Future Scenarios of Rainfall & Temperature over India • IS92a (8 Coupled Atmos.-Ocean GCMs) • SRES A2 (5 AOGCMs) • SRES B2 (5 AOGCMs) Simulations are generally available for about 200 years (~1870s till 2100)
5 state-of-the-art climate models run until 2100 with various emission scenarios IPCC 2001 climate change scenarios A1: A world of rapid economic growth and rapid introductions of new and more efficient technologies A2: A very heterogeneous world with an emphasis on family values and local traditions B1: A world of ‘dematerialization’ and introduction of clean technologies B2: A world with an emphasis on local solutions to economic and environmental sustainability
Predicted precipitation change 2080-2000 Source: IPCC 2001 Cubasch
AOGCM simulations used from IPCC-DDC Using greenhouse gas forced (following IS92A, SRES (A2/B2) scenarios) simulations of 8 different coupled ocean-atmosphere general circulation models, the rainfall and temperature scenarios for 2021-40; 2041-60; 2061-80; 2081-2100 compared to the baseline period of 1961-90 are generated for the Indian region. The models used are: 1.Canadian Center for Climate modeling (CCC) model. 2. Center for Climate Research studies (CCSR) model. 3. Australia's Commonwealth Scientific and Industrial Research Organization (CSIRO) model. 4. Deutsches Klima Rechen Zentrum (DKRZ) model. 5. Geophysical Fluid Dynamics Laboratory (GFDL) model. 6. Hadley Centered model.(HadCM3) 7. Max-planck Institute(MPI) model. 8. National Center for Atmospheric Research (NCAR) model.
Global Summer (JJAS) Precipitation Patterns simulated by 8 coupled AOGCMs
Indian Summer Monsoon Patterns as simulated by 8 coupled AOGCMs
Annual Surface Air Temperature Patterns over India simulated by 8 coupled AOGCMs
Climate Change Scenarios of Rainfall over the Indian Region in 8 Coupled Models
Climate Change Scenarios of Surface Temperature over the Indian Region in 8 Coupled Models
Monsoon Precipitation Change (% of 2041-60 as compared to 1961-90 period) due to GHG Increase
Monsoon Precipitation Change (% of 2061-80 as compared to 1961-90 period) due to GHG Increase
Annual Surface Temperature Change (Deg. C in 2061-80 compared to 1961-90 period) due to GHG Increase
High-resolution Climate Change Scenarios using Regional Climate Model (HadRM3)
The Hadley Centre Regional Climate Models(HadRM2/HadRM3) • High-resolution limited area model driven at its lateral and sea-surface boundaries by output from HadCM • Formulation identical to HadAM • Grid : 0.44° x 0.44° • One-way nesting • Joint Indo-UK Collaborative research programme on climate change impacts in India • Climate change simulations performed by the Hadley Centre using HadRM2 for the Indian region (the output is being currently analysed by IITM) • HadRM3 installed at IITM; Climate change simulations and scenario development in progress at IITM
Observed and Simulated Indian Summer Monsoon Rainfall (GCM vs. RCM)
Observed and Simulated (GCM and RCM) Surface Air Temperature over India
Simulation of Monsoon Depressions/Cyclonic Storms in HadRM2 and Likely Future Changes • Changes in Monsoon Depression/Cyclonic Storm Tracks in GHG Scenarios. • Frequency of Depressions/Cyclones. • Intensity of Storms.
Sea level Pressure (SLP) Local Minimum SLP Departure < -5hPa Max. Wind Speed > 15 m/s Duration At least 2 days Criteria adopted for the identification of cyclonic storms (this includes severe storms and monsoon depressions)
A typical Monsoon Depression as simulated in the regional model
Monsoon Depression Tracks as simulated in HadRM2 control and GHG Experiments
Pre and Post-Monsoon Cyclonic Storms and likely Changes in GHG Runs
Frequency of monthly cyclonic disturbances (Max intensity in m/s) as simulated by HadRM2 for 2041-60
Likely Changes in Extreme Rainfall and TMAX/TMIN Temperatures in India
Location of Stations Considered in Extreme Temperature Analysis
Simulation of No. of Rainy Days in the Hadley Center Regional Model and likely future changes in 2041-60
Intensity (mm/day) of Rainfall per rainy day and likely future changes in 2041-2060
Impact of Climate Change on the daily Extreme Rainfall (cm) amounts in India
Impact of Climate Change on the daily Extreme Tmax. (Deg. C) India
Impact of Climate Change on the daily Extreme Tmin. (Deg. C) India