Understanding Plate Tectonic Rates: Uplift, Denudation, and Processes in Geology
This lecture explores the rates of plate tectonics, surface uplift, and denudation, essential for understanding geological processes. Tectonic rates range from 1-20 cm/year, influencing uplift rates governed by isostatic responses. Different denudation rates, including erosional and tectonic, impact exposure of crustal levels. Extension rates, especially in the Basin and Range, show significant rates affecting tectonic movements. The dynamics of thrust belts and metamorphic processes highlight how geological environments respond to tectonic forces over time. This comprehensive study integrates various geological phenomena.

Understanding Plate Tectonic Rates: Uplift, Denudation, and Processes in Geology
E N D
Presentation Transcript
Regional Tectonics Geos 425/525 Fall 2007 Tectonic rates; Oceanic lithosphere I LECTURE 5, September 2, 2009 47 slides, 70 mins
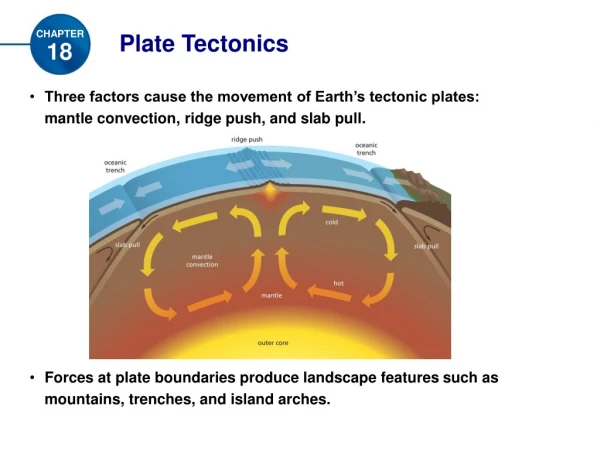
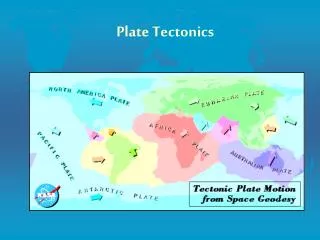
Plate tectonic rates • We already know that plate tectonic rates are in the 1-20 cm/year range, or 10- 200 km/yr. • For example, in the case of fast subduction/collision (say 10 cm/yr), it only takes about 1 million years before a material point at the trench is at about 100 km depth,if subduction angle is 45 degrees. Wow.
Rates of uplift. The changing vertical position of a point on the land surface as a function of time = surface uplift. • Surface uplift = bedrock uplift + deposition - compaction - denudation.
Uplift rates • Think denudation as being erosion for now, although it is a little more complicated (see later). Bedrock uplift rate is the rate at which bedrock is being carried upward by tectonic processes. Deposition and compaction apply only to sedimentary basins and are ignored when dealing with bedrock. There could be significantly different response of an orogenic belt locally vs. regionally. Regional uplift is governed by isostatic response to loading or unloading, whereas individual points (e.g. Mt Whitney) do not. Example: the Santa Lucia Mountains, CA. • Uplift rates can be isostatic and tectonic. Tectonic is what is not attributable to isostatic response, but to shortening. The total uplift rate is a sum of the tectonic and isostatic components.
Rates of denudation • Denudation is removal of material from a point on the Earth’s surface. Denudation leads to exposure of different crustal levels. • There are two types of denudation: erosional and tectonic. Erosion is mechanical and chemical weathering of rocks and removal by geomorphic agents. • Rates of erosion are typically 0.0x mm/yr (see table for summary for major rivers). At the absolute maximum, rates of erosion have been recorded to be 0.3 mm/yr. • Tectonic denudation is due to crustal thinning and leads to unroofing via fault slicing. They can be an order of magnitude higher or more, up to cm/yr for relatively short periods of time. For example, the Catalina Mts, north of Tucson, have been denuded at a good 4 mm/yr rate at around 20 Ma.
Denudation rates can be determined using river sediment yield, structural and stratigraphic controls etc. By far the most common tool is thermochronology –some major thermochronometers are shown in Fig below.
Example: apatite U-Th-He Slope tells the denudation rate, some 2 km over 20 my, or 1mm/yr
Rates of continental extension • How fast did the Basin and Range form? Does it add the missing displacement along the San Andreas, and thus is it representing an integral part of the plate boundary? How fast does a forearc collapse after tectonic erosion? • Extension rates can be several mm/yr, up to plate rates. One way to determine extension rates is using thermochronology. Continental extension is a major “within plate” phenomenon, that is directly tied to plate kinematics. Basin and Range extension accommodates part of the obliquity in the PAC-NA slip vector at various times during the late Cenozoic. • Normal faults move in short pulses of high rates. Consequently, basin development and range uplift has to mimic those rates.
Rates of thrust belt propagation • Fold and thrust belts propagate towards the foreland at rates of several mm to cm/yr. • For example, the NA Cordilleran FTB has migrated about 1000 km within ~100 Ma (De Celles, 2004). • Same numbers apply to major collisional belts like the Himalayas or accretionary margins (Alps, Cascadia, etc).
Rates of metamorphic processes • Dynamo-thermal metamorphism is fast. The theory of kinetics has shown that metamorphic minerals (such as garnet) grow at rates of mm to cm per year, suggesting that once a rock has been exposed to metamorphic conditions it re-equilibrates almost at lab time scales. • Prograde reactions tend to be erased because of that. Windows into the prograde history are rare. • Retrograde paths are kinetically more sluggish. Typical path of a metamorphic rock is shown in fig below. • PT and time determinations for several orogens indicate that this loop can be closed at rates of several mm to even cm/yr. That is a rock can be taken down to 60 km and back up within a couple of million years (and experience metamorphism).
Rates of ductile deformation • They are potentially much faster than plate rates, implying that if there is a pressure gradient and conditions for crustal flow are met in the mid-crust, the flow will accommodate the pressure gradient over short time periods. A material point can be traveling in the mid crust at speeds of several meters per year.
Ductile marble, Coast Mountains, BC. Ductile deformation in granite, now gneiss, Catalina Mts., AZ.
Rates of basin development • Basins are great indicators of surrounding tectonic environments – the rate at which a basin accumulates sediment mimics the dynamics of the source region. Range: from 0.001 mm/yr to several mm per Ma.
Miocene syntectonic sediments formed in the Tucson basin during detachment faulting
Rates of intracontinental deformation • Within plate deformation, is much slower than plate kinematics. Vertical motions are related to (1) isostatic glacial rebound, (2) steady state decay of old topography, and (3) eustatic loading around passive margins. All are around 0.0x mm/yr. Glacial rebound is used to constrain the viscosity of the upper mantle. • Lateral rates were difficult to constrain before GPS days. We do know now that a plate like NA is far from being rigid and that several major brittle faults moving at rates much (tens of times) slower than plate boundaries break up a rigid continent in several smaller blocks.
The oceanic lithosphere 1. The architecture of the oceanic crust 2. Fast vs slow spreading ridges 3. Ultra slow spreading ridges 4. Continental breakup
ocean ridges: where new oceanic lithosphere is created lithosphere moves away from crest of ridge seafloor spreading …at ridge axis, extensional tectonics dominates schematic section through oceanic crust and upper mantle at spreading ridge ophiolites (more in a minute) from: van der Pluijm and Marshak, 1997 from: http://www.earth.nwu.edu/personal/seth
deeper parts of ocean basins correspond to older crust… (…this ignores trenches…) relationship noted of age vs. depth d = 2500 + 350(t)1/2 only true for lithosphere < 80 Ma age relationship for seafloor > 60-80 Ma is different d = 6400 - 3200exp(-t/62.8) from: Kearey and Vine, 1996
thermal boundary layer model for seafloor topography (Turcotte and Oxburgh, 1967) as seafloor moves away from ridge, it cools and thermally contracts …increasing its density
bathymetry of North Atlantic: consistent with age relationships? from: http://topex.ucsd.edu/marine_topo
bathymetry/morphology of oceanic ridges depends on spreading rate: slow slow: < 5 cm/yr; axial rift valley (depression) fast from: http://www.soc.soton.ac.uk/CHD/classroom@sea/carlsberg from: van der Pluijm and Marshak, 1997
fast-spreading: magma enters a large magma chamber in crust; …broad bulge exists at ridge slow-spreading: magma chamber freezes between pulses of …spreading; axial rift valley occurs from: http://www.geo.lsa.umich.edu/~crlb/COURSES/270
bathymetry, spreading rate, ridge axis characteristics slow intermediate fast from: Kearey and Vine, 1996
slow-spreading ridge from: http://www.geo.lsa.umich.edu/~crlb/COURSES/270 cross-section (Mid-Atlantic Ridge) diagram on left shows alternating phases of construction and extension from: Kearey and Vine, 1996
“classic ridge” (slow-spreading) map from: http://www.soc.soton.ac.uk/CHD/classroom@sea/carlsberg
seismic refraction data fast spreading ridge model from seismic data fissure eruption on Mauna Loa from: http://gore.ocean.washington.edu/classpages/ocean410/
what about along axis variations? mid-ocean ridges composed of segments of various lengths… …bound by transform faults/fracture zones (1st order discontinuity) …50 km on average…more in Atlantic than in East Pacific Rise… mid-Atlantic Ridge East Pacific Rise segments thought to behave independently from each other …each segment related to source deep in mantle below… from: http://gore.ocean.washington.edu/classpages/ocean410/
fast-spreading ridges…2nd order discontinuity divided into segments 10-2000 km long by overlapping ridge tips …overlapping spreading centers (OSC) can you find OSC(s) on image to the right? from: http://gore.ocean.washington.edu/classpages/ocean410/
slow-spreading ridges… 2nd order discontinuity divided into segments by non-transform offsets …typically average 50 km… axial valley has hourglass shape (narrower in center than ends) from: http://gore.ocean.washington.edu/classpages/ocean410/
discontinuities classified by shape, size, longevity first: transform fault second: fast: large OSC offsets ridge by > 2 km slow: NTO jog in valley third: fast: small OSC offsets ridge by 0.5 to 2.0 km slow: gap between volcanoes from: McDonald and Fox, 1990
OSC can generate off-axis features: …new tips develop and old ones move away through spreading East Pacific Rise at 21°S from: McDonald and Fox, 1990
what about an extremely slow (< 1.5 cm/yr) spreading ridge? predictions? Gakkel Ridge, Arctic SW Indian Ridge
SW Indian Ridge drill holes contain • peridotite (green dots) • basalt (red dots) peridotite: mantle rock
Gakkel Ridge: mantle exposed over large regions of seafloor-- --peridotite altered to serpentinite • crust very thin • abundant hot springs • widely-spaced volcanoes • lavas more Na, K rich • no transform faults mantle emplaced as blocks where there is no seafloor processes similar to early stages of continental break-up and drift …structure of ultraslow ridges similar to continental margins at depth…
Summary of ocean ridge tectonics • Fast spreading - typical crustal section with the 5-7 km crustal thickness as seen in many ophiolites; no axial valley; • Slow spreading ridges - more extension, mantle sections exposed; axial rift valley;
Next Lecture • Preserving oceanic lithophsere in the geologic record.