Download
1 / 58
590 likes | 711 Vues
This comprehensive assessment by the European Commission analyzes the Common Agricultural Policy (CAP) reforms towards 2020. It outlines the methodologies used, including public consultations and contributions from multiple Directorate-Generals. The report emphasizes key objectives such as redistribution of direct payments, greening initiatives, and support for small and young farmers. It compares various policy scenarios, evaluates impacts on income and environmental performance, and discusses the importance of monitoring and evaluation for future CAP effectiveness.

E N D
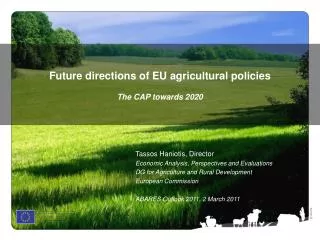
The CAP towards 2020Impact assessment European Commission DG Agriculture and Rural Development Directorate for Economic Analysis, Perspectives and Evaluations
Outline • Part I • Process • Methodology • Structure of the report • Objectives • Scenarios • Impacts • Monitoring and evaluation • Part II • Direct payments: • Redistribution of DP • Greening • Small farmers • Young farmers • Rural development • Allocation of RD envelopes
Process • Inter-service steering group • Between April 2010 and June 2011 • Composed of 20 DGs: SG, SJ, BEPA, BUDG, CLIMA, COMP, DEVCO, ECFIN, EMPL, ENER, ENTR, ENV, ESTAT, JRC, MARKT, OLAF, REGIO, RTD , SANCO, TRADE 2. Public Consultation • 517 contributions + Conference for stakeholders • Strong CAP based on two pillars • Focus on targeting, greening and better integration with other policies 3. Impact Assessment Board opinion • Recognises the amount of analysis conducted and an open process • Main issues addressed in revised document: description of sub-options, simplification, monitoring and evaluation
Methodology • Internal analysis and studies • Combination of agricultural market outlook projections and simulation of impacts at macro and micro level (FADN) • International workshop on market outlook prospects and uncertainties 2. Contributions from the Steering Group members • Thematic working groups, led by different DGs • Economic and prospective studies (JRC) 3. Evaluations and research projects • Both quantitative and qualitative information (e.g. RD mid-term evaluations) • Listed in annex 11
Structure of the report • The CAP impact assessment process • Policy context, problem definition and EU value added • Objectives • Policy scenarios • Analysis of impacts • Comparing the scenarios with respect to objectives and impacts • Monitoring and evaluation • List of annexes • List of thematic groups • Situation and Prospects for EU Agriculture and Rural Areas • Greening the CAP • Direct payments • Rural Development • Market Measures • Risk Management • Research and Innovation • Simplification • Report on the Public Consultation • Impact of Scenarios on the Distribution of Direct Payments and Farm Income • Methodology; evaluations and research projects relating to CAP • Developing countries
Setting reform objectives Improving: the advisory system and networks (of farmers, advisors, researchers, food operators, consumers etc.) for knowledge creation and transfer pro-competitive joint action among farmers and across the food supply chain in order to foster efficient use of resources, product development and marketing productivity and competitiveness incentives to use risk management instruments and active prevention strategies increasing the number of agricultural areas which are under agricultural practices providing environmental and climate action benefits and encouraging the take-up of more advanced agri-environmental measures by Member States and farmers environmental and climate change performance rebalancing the direct payment to better reflect the objectives of income support and improved environmental performance effectiveness and efficiency reducing the disparities in direct payment support levels between Member States and farmers reducing administrative burden for farmers and managing authorities of existing tools without watering down their efficiency and effectiveness
Building policy scenarios Continue the reform process by introducing further gradual changes while adjusting the most pressing shortcomings (e.g. more equity in the distribution of direct payments) Adjustment Capture the opportunity for reform ensuring that CAP becomes more sustainable and balanced (between policy objectives, MS and farmers) through more “green” targeted measures Integration More fundamental reform focusing entirely on environmental and climate change objectives through rural development, moving away from income support and most market measures Re-focus
Redistribution of DP – economic criteria Source: European Commission, DG Agriculture and Rural Development – Commission Staff Working Paper ‘Impact Assessment – CAP towards 2020’ (budget data from the MFF Communication - COM (2011) 500 (excluding cotton and POSEI); hectares of potentially eligible area in 2009)
Redistribution of DP – environmental criteria Source: European Commission, DG Agriculture and Rural Development – Commission Staff Working Paper ‘Impact Assessment – CAP towards 2020’ (budget data from the MFF Communication - COM (2011) 500 (excluding cotton and POSEI); hectares of potentially eligible area in 2009)
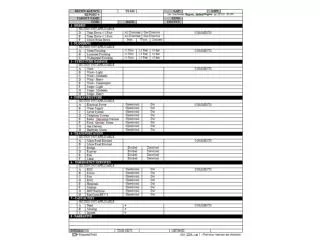
Impact of the different criteria compared to the flat rate - ++ ++ -- - + ++ -- -- - ++ -- ++ -- -- - -- -- - - - ++ ++ -- -- -- -- -- + ++ - -- - - - - -- -- -- - ++ - + ++ -- -- ++ -- ++ - - + + ++ ++ -- - + + -- ++ + + + + - -- - - - + + ++ + - + - - - ++ ++ + ++ -- -- -- -- +/- ++ +/- + -- -- -- - + - - ++ -- ++ ++ - + ++ - -- -- +/- -- ++ -- - -- ++ +/- ++ -- -- + ++ ++ +/- -- -- + ++ ++ - +/- + - ++ -- -- - ++ + + -- -- - + + ++ - ++ -- + - -- ++ -- +/- - - ++ + ++ ++ ++ -- -- -- -- + ++ -- ++ ++ -- -- ++ ++ -- + ++ -- -- - ++ -- - ++ -- -- - -- --
Redistribution of DP – minimum 80% of EU-27 average Source: European Commission, DG Agriculture and Rural Development – Commission Staff Working Paper ‘Impact Assessment – CAP towards 2020’ (budget data from the MFF Communication - COM (2011) 500 (excluding cotton and POSEI); hectares of potentially eligible area in 2009)
Redistribution of DP – minimum 90% of EU-27 average with objective criteria Source: European Commission, DG Agriculture and Rural Development – Commission Staff Working Paper ‘Impact Assessment – CAP towards 2020’ (budget data from the MFF Communication - COM (2011) 500 (excluding cotton and POSEI); hectares of potentially eligible area in 2009)
Redistribution of DP – closing 1/3 of the gap between current level and 90% of EU-27 average Source: European Commission, DG Agriculture and Rural Development – Commission Staff Working Paper ‘Impact Assessment – CAP towards 2020’ (budget data from the MFF Communication - COM (2011) 500 (excluding cotton and POSEI); hectares of potentially eligible area in 2009)
Greening: Share of farms bearing the costs of greening measures Source: European Commission, DG Agriculture and Rural Development – Commission Staff Working Paper ‘Impact Assessment – CAP towards 2020’
Greening: Average total cost of greening per MS Source: European Commission, DG Agriculture and Rural Development – Commission Staff Working Paper ‘Impact Assessment – CAP towards 2020’
Greening: Average total cost of greening per MS – only for farms which bear a cost Source: European Commission, DG Agriculture and Rural Development – Commission Staff Working Paper ‘Impact Assessment – CAP towards 2020’
Greening: The distribution of farms according to greening costs Source: European Commission, DG Agriculture and Rural Development – Commission Staff Working Paper ‘Impact Assessment – CAP towards 2020’
Estimated cost for ecological set-aside Source: European Commission, DG Agriculture and Rural Development – Commission Staff Working Paper ‘Impact Assessment – CAP towards 2020’
Estimated cost for maintaining permanent grassland Source: European Commission, DG Agriculture and Rural Development – Commission Staff Working Paper ‘Impact Assessment – CAP towards 2020’
Total cost for greening Source: European Commission, DG Agriculture and Rural Development – Commission Staff Working Paper ‘Impact Assessment – CAP towards 2020’
Average farm size and farms below 5 ha UAA Source: Eurostat, Farm Structure Survey 2007
Budget and number of beneficiaries in the scheme for small farmers (5% budget) Source: European Commission, DG Agriculture and Rural Development – Commission Staff Working Paper ‘Impact Assessment – CAP towards 2020’ (own calculation using CATS data for financial year 2009)
Rural development • Methodology • Largely qualitative analysis on the basis of evaluations, studies, RTD projects • See also IA for the reform of the structural funds • Structure • Assessment of current policy in the light of future challenges and opportunities • Identification of main issues for the reform and formulation of policy options • Alignment with Europe 2020 • Policy delivery, incl. coherence with other policies • Budget and distribution • Analysis of impacts for each option on: • Agriculture • Environment and climate change • Socio-economic development of rural areas • Distribution of support: alternative options
Distribution • Background: Modulation formula • (0.65 Area + 0.35 Labor) x GDP inverse index • Analysis of different options using a two-fold approach: • Using criteria linked to the policy objectives, such as: • Objective 1: Area, Labor, Labor productivity inverse index • Objective 2: Area, N2000, NHA, Forest, Permanent pasture areas • Objective 3: Rural population, GDP inverse index and • Factoring in the current distribution • Impact: • Use of objective criteria allows for a better use of budgetary resources • Smooth redistribution allows for continuity
Example: use of objective criteria Formula: [1/3 [(½ Area + ½ Labor) inv index labor prod] + 1/3 (1/3 NHA area + 1/3 N2000 + 1/6 Forest + 1/6 PP) + 1/3 Rural pop] x GDP inv index Source: European Commission, DG Agriculture and Rural Development – Commission Staff Working Paper ‘Impact Assessment – CAP towards 2020’ Note: This distribution key doesn't take into account the transfers made through the market reforms in the tobacco, cotton and wine sectors
Example: Use of objective criteria within 90-110% range and current distribution Source: European Commission, DG Agriculture and Rural Development – Commission Staff Working Paper ‘Impact Assessment – CAP towards 2020’
Agriculture under growing pressure (1)Agricultural and food prices have recently reversed their long-term trends Source: World Bank
Agriculture under growing pressure (2)with positive medium-term price projections for the EU …
Agriculture under growing pressure (3)… but deterioration of the sector’s terms of trade Source: Eurostat
Agriculture under growing pressure (4)… and difficulties linked to the functioning of the food supply chain Source: Eurostat
Agriculture under growing pressure (5)… with direct translation on the income situation Source: DG Agriculture and Rural Development, based on Eurostat data
Level of direct payments and total operating subsidies as a percentage of agricultural factor income (avg. 2007-2009) Source: DG Agriculture and Rural Development Note: Total operating subsidies include state aids granted by Member States
… while having to meet EU ambitions on environment and biodiversity protection, climate action and energy efficiency ...Declining trend of GHG emissions in EU agriculture since 1990 EU-27 = -20% EU-15 = -12% Source: EEA
Climate change – Possible impacts on EU agriculture ▲ Floods risk ▲ Hotter and drier summers ▲ Sea levels ▲ Risk crop pests, diseases ▲ Crop, forage yields ▼ Animal health, welfare ▼ Summer rainfall ▲ Winter storms, floods ▲ Length growing season, yields ▲ Suitable farmland ▲ Pests, diseases risks ▲ Winter rainfall, floods ▼ Summer rainfall ▲ Risk drought, water stress ▲ Soil erosion risk ▲ Yields, range of crops ▼ Water availability ▲ Risk drought, heat spells ▲ Risk soil erosion ▼ Growing season, crop yields ▼ Optimal crop areas Source: DG Agriculture and Rural Development, based on EEA reports, JRC and MS academic studies