Download
1 / 28
300 likes | 436 Vues
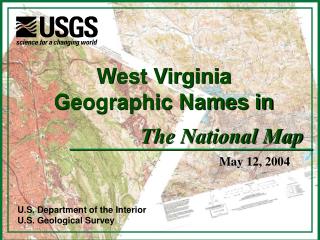
Arsenic and Uranium in Water from Private Wells Completed in Bedrock of East-Central Massachusetts—Concentrations, Correlations with Bedrock Units, and Estimated Probability Maps.

E N D
Arsenic and Uranium in Water from Private Wells Completed in Bedrock of East-Central Massachusetts—Concentrations, Correlations with Bedrock Units, and Estimated Probability Maps U.S. Geological Survey in cooperation with the Massachusetts Department of Environmental Protection and the Massachusetts Department of Public Health US Department of Interior US Geological Survey
Arsenic in public supply bedrock wells in New England In Massachusetts,arsenic in groundwater appears to be limited to zones in the east-central and northeast parts of the state
Bedrock units and study-area boundaries Sampling sites were selected to cover each rock unit in the study area
Arsenic--black border circles are samples that exceed the standard
Uranium--black border circles are samples that exceed the standard
Likelihood, by bedrock unit, that well water will exceed the arsenic standard
Likelihood, by bedrock unit, that well water will exceed the uranium standard
WATER PROSPECTING--ARSENIC 3.7% (1.0-10) N = 33 23% (18-29) n = 155 0.8% (0.04-6.5) n = 31
WATER PROSPECTING— URANIUM 8.4% (4.0-16) 0.2% (0.0-1.8) 0.03% (0.0-6.2) 0.9% (0.1-4.4) 12% (2.8-34)
Inferred locations of private wells from tax and water supply database comparisons and from the 1990 census
Estimated number of wells affected • Estimated by multiplying the number of estimated wells for a rock type times the probability for the rock type that a well will contain water that exceeds the standard. • For arsenic 5,700 wells are estimated to exceed the limit. • For uranium 3,300 wells are estimated to exceed the limit.
Water-use questionnaire results • 66 percent of respondents with well water that exceeded the standard for arsenic were using the water for drinking without treatment. • 93 percent of respondents with well water that exceeded the standards for uranium were using the water for drinking without treatment.
Outreach to the Public • Joint USGS/MDPH/MassDEP press release providing: • Summary of results • Where to obtain additional information • MassDEP posts a general FAQ document regarding the USGS study results and comprehensive outreach material on-line • MDPH posts Q & A document regarding urinalysis effort • MassDEP and MDPH staff at 211 MEMA call center on day of release and next day
Information Provided on MassDEP Web Site • Link to USGS report • GIS mapping tool • Town Maps showing arsenic and uranium probability zones • Information regarding where to have water analyzed and treatment options and cost estimates • Information regarding health risks • Link to MDPH Q & A document regarding urinalysis effort
Statewide Arsenic Probability Map Insert following arsenic map on this slide: http://www.mass.gov/dep/water/drinking/au/potential_state_ar.pdf
Statewide Uranium Probability Map Insert following uranium map on this slide: http://www.mass.gov/dep/water/drinking/au/potential_state_ur.pdf
Westford is my preference for the uranium map but only if a legend appears. It doesn’t appear when I download the map from home. If it does I believe is will appear across the top of the map. If so, split image in 2 as for the As map of Stow. If no legend for Westford use the uranium map for Townsend instead. Don’t split the Townsend map in two because the legend appears along the right side of the map, not along the top. http://www.mass.gov/dep/water/drinking/au/maps/westford_u.pdf
Public Inquiries USGS report: John Colman, USGS jacolman@usgs.gov 508 490-5027 Health Effects: MDPH 617 624-5757 Arsenic Treatment: Joe Cerutti, MassDEP joseph.cerutti@state.ma.us 617 292-5859 Uranium Treatment: Steve Hallem, MassDEP stephen.hallem@state.ma.us 617 292-5681
Arsenic Treatment Options • Point of Use vs. Point of Entry • Composition: As III vs. As V
Arsenic Treatment Options Treatment Options: • Filter Cartridges: Iron Oxide Activated Alumina • Reverse Osmosis: Only filters As V • Anion Exchange: Whole house treatment
Uranium Treatment Options • Reverse Osmosis • Anion Exchange