Download
1 / 26
270 likes | 503 Vues
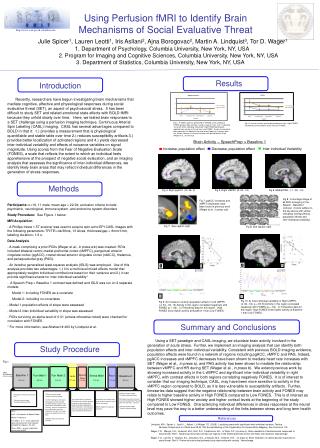
Physiologic Basis of fMRI Signals Focus on Perfusion MRI. John A. Detre, M.D. Center for Functional Neuroimaging Cognitive Rehabilitation Research Consortium University of Pennsylvania Moss Rehabilitation Institute Philadelphia, PA.

E N D
Physiologic Basis of fMRI SignalsFocus on Perfusion MRI John A. Detre, M.D. Center for Functional Neuroimaging Cognitive Rehabilitation Research Consortium University of Pennsylvania Moss Rehabilitation Institute Philadelphia, PA
Spatiotemporal Scales for Neuroscience Methodsadapted from Churchland Brain PET MEG+ERP Lesions Map fMRI Optical Dyes Log Size 2-deoxyglucose Column Layer Microlesions Neuron Single Unit Light Microscopy Dendrite Patch Clamp Synapse Millisecond Second Minute Hour Day Week Log Time
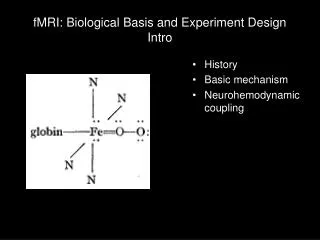
electrical activity - excitatory - inhibitory - soma action potential electrophysiology Imaging Physiological Correlates of Neural Function metabolic response FDG PET - ATP tightly regulated - glucose consumption - oxygen consumption H215O PET hemodynamic response - blood flow optical imaging - blood volume - blood oxygenation fMRI EEG MEG
Brain Mapping with fMRI • Hemodynamic/metabolic response used as surrogate marker for neural activity • BOLD fMRI signal represents a complex interaction between CBF, CBV, CMRO2: • CBF >> CMRO2 less deoxyhemoglobin with activation • CBF is monitored indirectly • “Tracer” is venous (though T2* effects can extend beyond vein) • Both magnitude and temporalpattern are modeled in fMRI data analysis • Potentially affected by normal physiology, pathophysiology, pharmacology
Activation-Flow Coupling • Blood flow and metabolism changes accompany brain activation • First described in late 1800’s by Mosso (Italy) and Sherrington (England) • Physiological basis remains poorly understood today Mosso, Atti R. Accad. Lincei 1880 (Italian) Sherrington and Roy, J. Physiol. 1890 Sir Charles Sherrington
Physiology of Functional Activation neuron ??? arteriole energetics receptors glucose membrane potential & firing • CBF with task activation • Linear with metabolism • vs. BOLD (see Hyder) oxygen capillary ion channels waste venule
Coupling of CBF, CMRGlu, and CMRO2 during Functional Activation • Uncoupling of CBF, CMRGlu, and CMRO2 Fox and Raichle, PNAS 1996 • CBF=CMRGlu>>CMRO2 • Predicts reduction in deoxyhemoglobin with activation • No increase in activated CBF with hypoglycemia Powers et al., Am. J. Physiol. 1996 • Suggests CBF is not required to supply glucose substrate • No increase in activated CBF with hypoxia Mintun et al., PNAS 2001 • Suggests CBF is not required to supply O2 substrate
Potential Physiological Influences on fMRI Signal cerebrovascular disease structural lesions (compression) blood flow medications autoregulation (vasodilation) blood volume hypoxia volume status BOLD contrast hypercarbia anesthesia/sleep biophysical effects anemia smoking oxygen utilization degenerative disease
Brain Mapping with fMRI - Definitions • Activation-Flow Coupling • Hemodynamic responses used as surrogate marker for neural activity in functional neuroimaging • Blood Oxygenation Level Dependent (BOLD) fMRI • represents a complex interaction between CBF, CBV, CMRO2 • “Tracer” is venous (though T2* effects can extend beyond vein) • CBF is monitored indirectly • Qualitative: only differences between conditions can be measured • Arterial spin labeling (ASL) Perfusion MRI • ASL = endogenous flow tracer (analogous to 15O-H2O in PET) • Quantitative: provides CBF in ml/100g/min (classical units) • Allows both resting CBF and CBF changes to be measured • Harder to implement and has lower SNR compared to BOLD
Direct MRI Measurement of Cerebral Blood Flowwith Arterial Spin Labeling (ASL) • Uses electromagnetically labeled arterial blood water as an endogenous flow tracer • Provides quantifiable CBF in classical units • Effects of ASL are measured by interleaved subtractive comparison with control labeling Detre et al., 1992 and ff
neural function behavior disease biophysics*** BOLD fMRI ASL CBF MRI Physiological Basis of fMRI metabolism blood flow ***BOLD contrast includes contributions from biophysical effects such as magnetic field strength homogeneity and orientation of vascular structures. ASL fMRI measures changes in CBF directly, and hence measured signal changes may be more directly coupled to neural activity
Brain Activation Analysis ASL or T2*-weighted Snapshot Image Average Difference Image Statistical Significance Image Thresholded Statistical Image Overlay on T1 Anatomic Image TIME SERIES ON TASK OFF fMRI SIGNAL
fMRI with BOLD Contrasttask activation Photic Stimulation Verbal Fluency Task calcarine cortex Broca’s area Wernicke’s area
Control - Label Single Slice Perfusion Image (about 1% effect) Perfusion MRI with Arterial Spin Labeling Control Inversion Plane B Field Gradient Imaging Slice Arterial Tagging Plane Continuous Adiabatic Inversion Geometry
Key Improvements in ASL MRI • Transit time correction • (Alsop and Detre, 1998) • Multislice • (Alsop and Detre, 1998) • Background suppression • (Ye et al., 2000) • High Field • (Wang et al., 2002) • Multicoil/Parallel Imaging • (Wang et al, 2005) • Snapshot 3D Imaging • (Duhamel and Alsop, 2004) • (Fernandez-Seara et al., 2005) • Improved Labeling • (Garcia et al., 2005) Data from David Alsop, BIDC SNR gains exceeding approaching 1000% over the past decade
Perfusion fMRI using ASL • Observe CBF changes directly • CBF changes are more linearly coupled to neural activity than BOLD effects • Resting and activated CBF in absolute units (ml/g/min) • Pathological conditions may affect resting CBF • Despite reduced sensitivity vs. BOLD, advantages for: • Spatial resolution (localizes to brain rather than vein) • Low frequency designs (behavioral states) • Group analyses (? reduced intersubject variability) • Regions of high static susceptibility gradient (non-GE EPI) • Statistical advantages (white noise)
Localization of Functional Contrast Perfusion Perfusion Activation draining vein BOLD Activation BOLD* *1.5T/Gradient Echo
Temporal Characteristics of Perfusion fMRI • Control/Label pair typically every 4-8 sec • “Turbo” ASL (Wong) can increase resolution by ~50% • Qualitative CBF (no control) in ~2 sec • S:N much lower than BOLD for event-related fMRI • Control/Label pair eliminates drift effects • White noise (instead of 1/f) • Stable over long durations (learning, behavioral state changes, pharmacological challenge etc.) • Sinc subtraction eliminates BOLD derivative
Perfusion vs. BOLD: Very Low Task FrequencyWang et al., MRM 2002 Only perfusion fMRI can detect activation with task and control separated by 24 hours
ASL Perfusion fMRI vs. BOLDImproved Intersubject Variability vs. BOLDAguirre et al., NeuroImage 2002 Group (Random Effects) Single Subject
Utility of ASL Perfusion fMRIin Clinical Research • Quantify CBF in cerebrovascular disorders • Perfusion imaging may reveal “functional” deficits without a structural correlate • Baseline CBF is a critical determinant of the capacity for activation-flow coupling with a task • Correlate “resting” CBF with cognitive deficits in cohort • Allows functional localization of affected regions • Avoids confound of impaired task performance during fMRI • Avoids need for cognitively impaired subject to perform during fMRI • CBF should be a stable biomarker across space and time • Ideal for multisite or longitudinal studies • This advantage has yet to be formally proven in a clinical study
Perfusion MRI in Cerebrovascular DiseaseIntracranial Stenosis with Bilateral Cognitive DeficitsJefferson et al., AJNR 2006 T2-weighted structural MRI: R>L ischemic changes Preop Perfusion MRI: Bilateral (R>L) hypoperfusion L Hemisphere CBF= 27 ml/100g/min* R Hemisphere CBF= 20 ml/100g/min Normal CBF= 50 ml/100g/min Postop Perfusion MRI: Bilateral increase in perfusion L Hemisphere CBF= 56 ml/100g/min R Hemisphere CBF= 53 ml/100g/min Perfusion MRI correlated better with cognitive deficits than structural MRI
Cognitive Correlations using Resting Perfusion MRI in Alzeimer’s Dementia • 17 Patients with clinical Alzheimer’s Disease • Noninvasive perfusion MRI in 5 mm slices • Correlation of CBF with cognitive performance on: • Semantic Category Membership Judgment • Confrontation Naming • Semantically-guided Category Naming Fluency • Sentence Comprehension RAW PERFUSION DATA SEMANTIC CATEGORY MEMEBERSHIP JUDGEMENT CONFRONTATION NAMING SEMANTICALLY-GUIDED CATEGORY NAMING FLUENCY SENTENCE COMPREHENSION This approach to localization of dysfunction also avoids having patient perform a task during MRI
Perfusion MRI Markedly decreased left hemispheric perfusion at rest Dissociation of Activation-Flow CouplingPatient with Left Intracranial Carotid Stenosis BOLD fMRI Lack of left hemispheric activation during motor task most likely reflects low resting CBF rather than any reorganization of neural function
neural function behavior & performance motion fMRI signal Considerations in Task-Activation fMRI(Summary) diagnostic fMRI pathology pathophysiology hemodynamic change clinical fMRI RR & HR Neuroscience fMRI physics noise
Conclusions • FMRI is measures neural activity indirectly • BOLD qualitatively reflects CBF and metabolism • ASL quantitatively reflect CBF • Clinical FMRI poses special challenges • Task performance effects must be considered • Underlying pathophysiology may alter coupling of activation and flow • FMRI identifies putative regions supporting task function • Does not establish necessity • Correlation with outcome, lesions, or TMS lesions can disambiguate • Many fMRI applications in neurorehabilitation • Mechanisms of neuroplasticity • Biomarker for therapy • Prediction of outcome • Bionic interfaces