How to Best Display Physiologic Signals
320 likes | 472 Vues
How to Best Display Physiologic Signals. Metaphor graphic display led to interpretations twice as fast as a tabular (flow sheet) format. Cole WG, Stewart JG. Human performance evaluation of a metaphor graphic display for respiratory data. Methods Inf Med 1994;33:390–6. Ohmeda Modulus CD.

How to Best Display Physiologic Signals
E N D
Presentation Transcript
Metaphor graphic display led to interpretations twice as fast as a tabular (flow sheet) format. Cole WG, Stewart JG. Human performance evaluation of a metaphor graphic display for respiratory data. Methods Inf Med 1994;33:390–6.
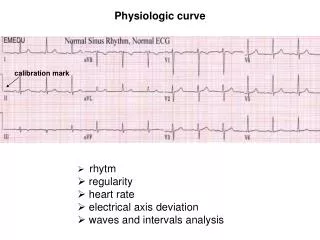
120 Iso ED50 100 % 15 15 80 Fent 90 Atra Prop 70 500 50 +2 +1 TV 0 30% o 37 -1 o 35 -2 SV 5% MAC 10 HR 100 100 RR Michels P, Gravenstein D, Westenskow DR. An integrated graphic data display improves detection and identification of critical events during anesthesia. J Clin Monit 1997;13:249 –59.
With the graphical interface: • two of four events seen 2.4 - 3.1 min sooner • three of four events identified correctly • important gains given the time frame of anesthesia.
Jungk A, Thull B, Hoeft A, Rau G. Evaluation of two new ecological interface approaches for the anesthesia work place. J ClinMonit 2000; 16: 243^258
Jungk Configural display: • most effective restoration of patient status to normal • anesthesiologists identified cuff leakage and blood loss events significantly faster than with standard display
Hypovolemia Blike GT, Surgenor SD, Whalen K, Jensen J. Specific elements of a new hemodynamics display improves the performance of anesthesiologists. J Clin Monit Comput 2000;16:485–91.
Event Recognition Anesthesiologists recognized the signs of clinical shock earlier and made fewer errors classifying the kind of shock than when using a conventional digital display. Blike GT, Surgenor SD, Whalen K, Jensen J. Specific elements of a new hemodynamics display improves the performance of anesthesiologists. J Clin Monit Comput 2000;16:485–91.
Situational Awareness integrated display provides better support for maintaining awareness of patient state than a traditional display. Zhang Y, Drews F, Westenskow D, et al. Effects of integrated graphical displays on situational awareness in anesthesiology. Cogn Technol Work 2002;4:82–90.
Paper Study Wachter SB, Agutter J, Syroid N, et al. The employment of an iterative design process to develop a pulmonary graphical display. J Am Med Inform Assoc 2003;10:363–72.
Blike GT, Surgenor SD, Whalen K, Jensen J. Specific elements of a new hemodynamics display improves the performance of anesthesiologists. J Clin Monit Comput 2000;16:485–91.
* 300 * 250 200 Time to diagnose and treat (sec) 150 100 50 Obstructed Endotracheal Tube Bronchospasm Treat Treat Diagnose Diagnose Wachter B, PhD Dissertation, Univ of Utah, Dec 2003
Graphical Pulmonary Display Anesthesiologists readily recognized the graphical elements of the display, and Participants recognized pulmonary events 1.6 min faster with the graphical display.
Albert R, et al, Psychophysical Scaling of a Cardiovascular Information Display Visualization, IEEE 2003
Recognition Time • Recognize and Treat MI • With Display 3:33 min • Without Display 6:17 min • p < .001 • Recognize LV Failure • With Display 2:13 min • Without Display 5:00 min • p < .02 Agutter J, STA Proceedings, Jan 2004
How to best display information • “..displays are likely to be graphic representations…” • “..different facets of system information are brought into a coherent whole so that the operator’s need to engage in information integration is dramatically reduced.” [Peter Hancick: Operator Stress and Display Design, Ergonomics in Design, Spring 2003, pg 13-18]
How to Best Display Physiologic Signals show higher-order physiological functions or states by graphically configuring lower-level measures in a manner that makes the higher-level properties emerge. Penelope M. Sanderson, (Anesth Analg 2005;101:161–8)
Object Display Blike GT, Surgenor SD, Whalen K, Jensen J. Specific elements of a new hemodynamics display improves the performance of anesthesiologists. J Clin Monit Comput 2000;16:485–91.
Advanced Patient Monitoring Displays: Tools for Continuous Informing Integrated visual displays reveal higher-order properties of patient state and speed in responding to events, but their benefits under an intensely timeshared load is unknown. Penelope M. Sanderson, (Anesth Analg 2005;101:161–8)
Who decided what to display and how to display it ? • Engineering Dept ? • Marketing Dept ? • Medical Consultants ?
Who decided what to display and how to display it ? • Engineering Dept ? • Marketing Dept ? • Medical Consultants ?