Download

1 / 37
420 likes | 1.03k Vues
NBSLM03E (2010) Low Carbon Technologies and Solutions: Section 17 N.K. Tovey ( 杜伟贤 ) M.A, PhD, CEng, MICE, CEnv. Tidal Energy. Tidal Power. Tides arise from the rotational motion of the earth > differential gravitational field set up by the Earth, Moon, and Sun.

E N D
NBSLM03E (2010) Low Carbon Technologies and Solutions: Section 17 N.K. Tovey (杜伟贤) M.A, PhD, CEng, MICE, CEnv Tidal Energy
Tidal Power • Tides arise from the rotational motion of the earth > differential gravitational field set up by the Earth, Moon, and Sun. Several different tidal cycles:- • a semi-diurnal cycle - period 12 hrs 25 mins • a semi-monthly cycle - (i.e. Spring - Neap Tides) corresponding with the position of the moon. Sun, Earth and Moon in approximate alignment >> Spring Tides, • a semi-annual cycle - period about 178 days which is associated with the inclination of the Moon's orbit. Causes highest Spring Tides to occur in March and September. • Other long term cycles - eg a nineteen year cycle of the Moon. • Spring Tides have a range about twice that of neap tides, while the other cycles can cause further variations of up to 15%.
Tidal Power: The Resource Tidal Resource kW/m2 <0.01 0.01 2.90 Resource is measured in terms of kW/m2 of vertical column of water
Tidal Power: The Resource Output from 40 x 5m diameter turbines in Churchill Barrier – over whole of 2002
Tidal Power • The Tidal range is amplified in estuaries, and in some situations, the shape of the estuary is such that near resonance occurs – e.g Severn Estuary. • Other good locations for tidal energy – between islands • Race of Aldernay • Pentland Firth • Eynhallow Sound in Orkney • Fall of Warness, Orkney • Tide Mill at Woodbridge in Suffolk worked for several hundred years until finally closed in 1960s
Tidal Power • A barrage placed across such an estuary can affect the resonance conditions, and either enhance further the potential range or suppress it. Careful modelling is therefore needed in the evaluation of any scheme. • Potential power is proportional to area impounded and the square of the tidal range. Thus about 4 times as much power can be generated at spring tides as at neap tides.
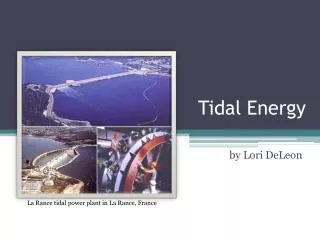
Tidal Power: Barrage Schemes La Rance – only sizeable plant in world – 240 MW Constructed in 1966 • Barrage Schemes – a barrier is constructed across an estuary • Tidal Stream (under water turbines) • Tidal Fence (a variant of Barrage and tidal stream) • Tidal lagoons (a variant of barrages) Unlike barrage does not provide for a road link.
Tidal Power: Barrage Schemes • Ebb Generation Flow: • Basin fills as tide rises through Sluice Gates • Sluice Gates closed at High Tide and basin level held until tide falls to • provide sufficient head difference. • Generation ceases when head difference falls below critical level • Generation is restricted to ~ 6 hours in any tidal cycle • Predictable but since tides are on 12.5 hour cycle generation may not • coincide when needed most. • Mean basin level higher than natural situation – issue for wading birds
Tidal Power: Barrage Schemes • Flood Generation Flow: • Basin is empty at low tide • Sluice Gates closed and no generation until tide level rises to provide • sufficient head • Generation occurs as water flows into basin ceases after high tide when • head difference falls below critical level. • Sluice gates opened to drain basin at low tide • Generation is restricted to ~ 6 hours in any tidal cycle • Generally less generation than on Flood mode. • Mean basin level lower than natural situation – problems for shipping
Tidal Power: Barrage Schemes- Two Way Generation +4 +2 0 -2 -4 Water Level (m) -4 -2 0 2 4 6 8 10 12 14 16 18 20 22 • Example shows possible power from a Severn Barrage Scheme • Less Power than EBB scheme, but better distribution through day 8 6 4 2 0 Power Output (GW)
Tidal Power: Severn Barrage Schemes • Single Basin Opportunity to build this at time of Second Severn Crossing was missed – part of cost could have been from provision of new road link. Location would be further downstream, but benefit from additional road link is limited.
Tidal Power: Severn Barrage Schemes: Double Basin • Upper Basin filled at High Tide • Lower Basin emptied at low tide • Could provide power on demand • Could incorporate pumped storage – not costed in design • Would provide better access for shipping (higher basin level – albeit via locks) • Would increase time of mud flats for wading birds (albeit slightly displaced in location
Tidal Power: Severn Barrage Schemes • Large Single Barrier
Tidal Power: Barrage de La Rance: St Malo St Malo 6 Sluice Gates 24 x 10 MW Turbogenerators Ecluse • Constructed in 1966 – 240 MW peak output
Tidal Power: Barrage de La Rance: St Malo Two way generation without pumping with pumping sans pompage avec pompage Turbinage Generation Turbinage Filling Attente Waiting Pompage Pumping Emptying Turbinage Generation Filling attente attente pompage
Tidal Power: Barrage de La Rance: St Malo • Can use pumping at high tide to enhance output. • Pumping not done if it coincides with peak demand • Pumping is done over low head – generation over higher head – hence a net energy gain.
Tidal Power: Barrage de La Rance: St Malo St Malo 6 Sluice Gates 24 x 10 MW Turbogenerators Ecluse
Tidal Power: Barrage de La Rance: St Malo Vortices created during generation at La Rance The Sluice Gates
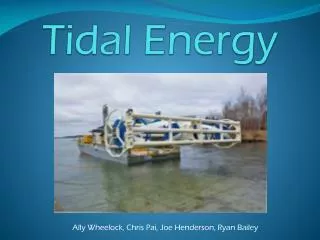
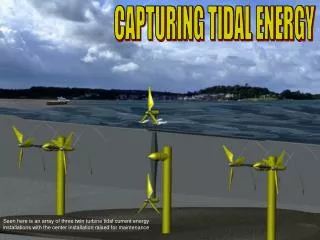
Tidal Power: Tidal Stream Under water Turbines Can be mounted on sea bed and be entirely submerged or penetrate surface
Tidal Power: Tidal Stream Floating Device In Survival Mode
Tidal Power: Lagoons A derivative of barrage • Create a lagoon surrounded by a barrier • Allow water to flood into lagoon and then generate through turbines. • Could have two lagoons – as double barrier scheme. • Claimed it could have higher load factor and less Environmental Issues • Would require a lagoon of 115 sq km and a barrier length of 60+km • Would require 200 million tonnes of rock fill – about 10 times that of basic barrier scheme. • Would generate no power until complete (all or nothing)
Tidal Power: Basic Theory • Barrier Schemes rely on potential energy • Energy available = mgh x volume flowing • But kinetic energy = potential energy • i.e. mgh = 0.5 m V2 (v = velocity) or V = √2gh • Mass flowing = density x volume • m = density x cross section area x velocity • m = R2 V (R is radius of turbine) • So energy available = 0.5 . R2 V . V2 = 0.5 R2 V3 • Allowing for efficiencyact, actual available energy = 0.5 act R2 V3 • Tidal Stream – rely on kinetic energy • Formula is same as for Wind Turbines • i.e. Energy Output = 0.5 actbetz R2 V3 • betz is the Betz Efficiency = 59.26%
Tidal Barrage: La Rance - example • The height (h) of the water level above mean sea level in the Rance Estuary in Northern France may be approximately found from the relationship:- • where t is the time in hours after high tide, • d is the range (maximum-minimum) of the tide = 9m, • and p is the period between high tides (12.5 hours in this case). • Generation of electricity takes place whenever there is a head difference of 2.089m or more, and continues until the level of water in the basin falls to 0.779m below mean sea level. The turbines have an efficiency of 60%. • Estimate how long generation can continue during each tidal cycle. Estimate also the mean output from the power station if a total of 108.73 million cubic metres of water pass through the turbines during generation.
Tidal Barrage: La Rance - example Use equation to work out height at each hour and then plot graph 2.089m below high tide 0.779 below mean tide
Tidal Barrage: La Rance - example 2.089m 2.089m • Basin held at high tide level until height difference is 2.089m • Start of generation coincides exactly with the 2 hour point. This can be checked as at two hours the difference from high tide is 4.5 - 2.411 = 2.089m). • Generation ceases when the level is 0.779m below mean tide, but the head of 2.089 must still be maintained. So the level of the tide when generation ceases will be:- -0.779 - 2.089 = - 2.868 i.e. exactly the height after 8 hours. So generation will occur for 8 - 2 = 6 hours Plot graph and measure off difference between basin and sea over generation period – e.g. example shows point at 6 hours.
Tidal Barrage: La Rance - example 1 • The energy generated at any one instant is ...... m.g.h • For MEAN OUTPUT find the mean head over the period. • There is a small catch here:- • For the shaded area we can take the approximation that the head is that for 6 hours, similarly for 4 hours and 5 hours etc. But for both 2 hours and 8 hours, the generation is for only half the time, so the mean height is given by:- 0.5 x 2.089 + 3.337 + 4.656 + 5.502 + 5.446 + 4.285 + 0.5 x 2.089 = ------------------------------------------------------------------------------------ = 4.219 m 6
Tidal Barrage: La Rance - example The time interval is 6 x 3600 seconds volume density of water | | So mean output = 108.73 x 106 x 1000 x 9.81 x 4.219 -------------------------------------------------- 6 x 3600 = 125 MW =======
Tidal Barrage (e.g.Churchill Barriers): Example • A man made causeway is built joining two islands. The high tide on the east is 3 hours before high tide on the west. – see table and graph. • Estimate the daily electricity production and the mean power produced for 4047 mm diameter turbine inserted into the causeway. • Power can be extracted if height difference exceeds 0.9m. • Density of sea water is 1070 kg m-3, • the efficiency of the turbines is 80%.
Tidal Barrage (e.g.Churchill Barriers): Example 2.5 25 2.0 20 East West 1.5 15 (kW) 1.0 10 2 0.5 5 Height (m) 0.0 0 Output power per m 0 2 4 6 8 10 12 -0.5 -5 -1.0 -10 -1.5 -15 -2.0 -20 -2.5 -25 • First work out the effective height difference in column 5. • when height is less than critical 0.9m there is no generation available. • Data are symmetric and many values are the same value (or same value but opposite sign) For simplicity a tidal cycle of 12 hours has been assumed – normally tidal cycle is ~ 12.5 hours Values in final column are for information only – not needed in actual calculation
Tidal Barrage (e.g.Churchill Barriers): Example potential energy of head difference = kinetic energy flowing through turbines i.e. mgh = 0.5 m V2 or V = sqrt( 2 g h) g is = 9.81 m s-2 Enter the values of velocity in column 5. Disregard the –ve Continuity mass passing per second = density x volume = density x velocity x cross section area = V R2 Energy available = 0.5 m V2 = 0.5 V R2 V2 = 0.5 R2 V3 substituting values for , , and R energy at any instant= 5505.1 V3 Care! Only 50% of hours 0 and 12! - density of sea water = 1070 kg m -3 - efficiency of turbo-generators ~ 80% R- diameter of turbine = 4047mm
Tidal Barrage (e.g.Churchill Barriers): Example • Energy available over tidal cycle = 5505.1 x V3 • But V3 = 2179.8 • [watch summation – do not count 0 (12) hours twice!!] • total energy over day ( two tidal cycles) will be • 2 * 5505.1 *2179.8 /1000/1000 MWh per day. = 24.00 MWh per day • rated output of the turbine = 24.00/24 = 1MW
Tidal Barrage: 2009 Proposed Schemes for Severn Newport Beachley Barrage Shoots Barrage Cardiff Cardiff – Weston Barrage Bristol Minehead – Aberthaw Barrage Weston Cardiff - Hinkley Barrage Minehead
Tidal Barrage: 2009 Proposed Schemes for Severn Newport Beachley Barrage Shoots Barrage Cardiff Cardiff – Weston Barrage Bristol Minehead – Aberthaw Barrage Weston Cardiff - Hinkley Barrage Minehead
Tidal Barrage: 2009 Proposed Schemes for Severn Newport Cardiff Bristol Weston Minehead
Tidal Barrage: 2009 Proposed Schemes for Severn Newport Cardiff Bristol Weston Minehead
Tidal Barrage: 2009 Proposed Schemes for Severn Newport Cardiff Bristol Weston Minehead