Download
1 / 74
740 likes | 760 Vues
This review discusses the Booster Neutrino Beam and CCQE events in MiniBooNE, including the MiniBooNE nm CCQE result review and nm flux in nm beam measurements. It also covers RFG model comparisons to nm CCQE data and future BooNE CCQE measurements, with conclusions.

E N D
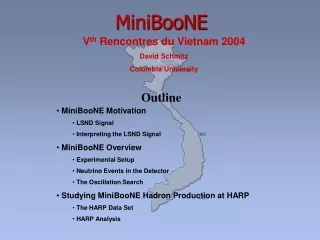
nm CCQE at MiniBooNE Joe Grange University of Florida NuInt ‘11 Dehradun, India
Outline • Booster Neutrino Beam • CCQE events in MiniBooNE • MiniBooNEnm CCQE result review • nm flux in nm beam measurements • RFG model comparisons to nm CCQE data • Future BooNE CCQE measurements, conclusions
Booster Neutrino Beam • CCQE events in MiniBooNE • MiniBooNEnm CCQE result review • nm flux in nm beam measurements • RFG model comparisons to nm CCQE data • Future BooNE CCQE measurements, conclusions
Booster Target Hall decay region absorber target and horn detector FNAL Booster dirt Booster primary beam secondary beam tertiary beam (protons) (mesons) (neutrinos) Booster Neutrino Beam 8.9 GeV/c momentum protons extracted from Booster, steered toward a Beryllium target in bunches of 5 × 10¹² at a maximum rate of 5 Hz
decay region absorber target and horn detector FNAL Booster dirt nm Booster primary beam secondary beam tertiary beam (protons) (mesons) (neutrinos) Booster Neutrino Beam Magnetic horn with reversible polarity focuses either neutrino or anti-neutrino parent mesons (“neutrino” vs “anti-neutrino” mode) p+ p- p- p+
MiniBooNE Flux • Flux prediction based exclusively on external data - no in situ tuning MiniBooNE collaboration, Phys. Rev. D79, 072002 (2009) • Dedicated pion production data taken by HARP experiment to predict neutrino flux at MiniBooNE • A spline fit to these data brings flux uncertainty to ~9% for pions produced in HARP-covered phase space HARP collaboration, Eur. Phys. J. C52 29 (2007)
Booster Neutrino Beam • CCQE events in MiniBooNE • MiniBooNEnm CCQE result review • nm flux in nm beam measurements • RFG model comparisons to nm CCQE data • Future BooNE CCQE measurements, conclusions
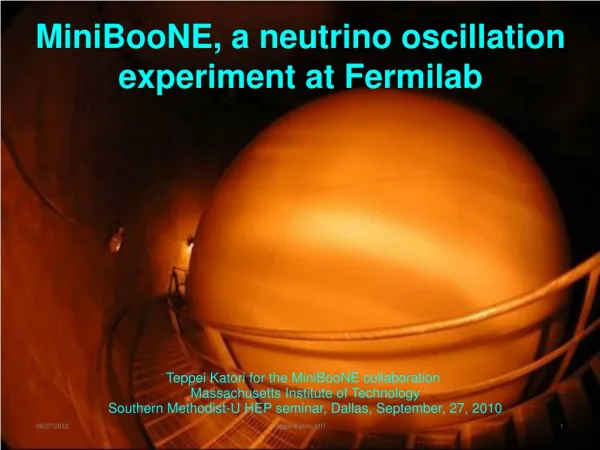
CCQE Events in MiniBooNE CCQE is the most prevalent interaction at MiniBooNE’s energy range, accounting for ~40% of all events. MiniBooNE: spherical Cherenkov detector, filled with 800 tons of undoped mineral oil (CH2) e+ m 80% CCQE purity 25% efficiency m+ p n Either bound (12C) or quasi-free (H) e No nucleon reconstruction
CCQE Events in MiniBooNE • MiniBooNE nuclear simulation: Relativistic Fermi Gas (RFG) model • Models nucleons as independent, quasi-free particles bound by a constant EB • All struck (outgoing) nucleons subject to Pauli blocking, enforced by a global Fermi momentum • Dipole axial form factor, FA(Q2) = 1.267(1 - Q2/MA2)-2 • Non-dipole vector form factor Nucl. Phys. B43 (1972) 605 Bodek et al,. arxiv:hep-ex/0308005
CCQE Events in MiniBooNE Only the muon from the primary interaction is observed, but we can reconstruct incident anti-neutrino energy and momentum transfer based on muon kinematics Under the assumption of a target proton at rest, (qm: muon angle wrt neutrino beam)
Booster Neutrino Beam • CCQE events in MiniBooNE • MiniBooNEnm CCQE result review • nm flux in nm beam measurements • RFG model comparisons to nm CCQE data • Future BooNE CCQE measurements, conclusions
MiniBooNE νμ CCQE Review • First presented NuInt09, T. Katori Phys. Rev. D81, 092005 (2010) • Measurements:
MiniBooNE νμ CCQE Review • First presented NuInt09, T. Katori Phys. Rev. D81, 092005 (2010) • Measurements: Using the RFG nuclear model, the axial mass MA and an empirical Pauli blocking scale was extracted from a shape-only fit to data
MiniBooNE νμ CCQE Review • First presented NuInt09, T. Katori Phys. Rev. D81, 092005 (2010) • Measurements: More interesting, nm CCQE s > 30% higher than expected!
MiniBooNE νμ CCQE Review • First presented NuInt09, T. Katori Phys. Rev. D81, 092005 (2010) • Measurements: • Primary result - extraction based on observables only • Independent of interaction model assumptions
Booster Neutrino Beam • CCQE events in MiniBooNE • MiniBooNEnm CCQE result review • nm flux in nm beam measurements • RFG model comparisons to nm CCQE data • Future BooNE CCQE measurements, conclusions
Wrong-sign Background G. P. Zeller • “Wrong signs”: anti-neutrinos in the neutrino beam and vice versa • MiniBooNE detector unmagnetized, cannot separate contributions based on CC interactions • Wrong-sign background far more serious in anti-neutrino mode due to both flux and cross section effects ~2% ~30%
Wrong-sign Background • Cross section: at MiniBooNE energies (En~1 GeV), neutrino cross section ~ 3x higher than anti-neutrino • Flux: leading particle effect creates ~ 2x as many π+ as π- p Be p+ p-
How wrong signs contribute to flux • Wrong-sign pions escape magnetic deflection and contribute to the anti-neutrino beam via low angle production • In anti-neutrino mode low-angle production is a crucial flux region and we do not have a reliable prediction This motivates a dedicated study of nm content of the beam
Wrong-sign measurements • Three independent and complementary measurements of the wrong-sign background: • Fitting the angular distribution of the CCQE sample for the neutrino and anti-neutrino content • Comparing predicted to observed event rates in the CCπ+ sample • Measuring how often muon decay electrons are produced (exploits μ- nuclear capture)
Wrong-sign measurements • Three independent and complementary measurements of the wrong-sign background: • Fitting the angular distribution of the CCQE sample for the neutrino and anti-neutrino content • Comparing predicted to observed event rates in the CCπ+ sample • Measuring how often muon decay electrons are produced (exploits μ- nuclear capture) First measurement of the nm content of a nm beam using a non-magnetized detector. arxiv:1102.1964
Wrong-sign measurements • General strategy: isolate samples sensitive to the nm beam content, apply the measured cross sections from neutrino mode (CCQE, CCπ+) • Crucial application of BooNE-measured nm s’s • The level of data-simulation agreement then reflects the accuracy of the nm flux prediction
Wrong-sign measurements • Three independent and complementary measurements of the wrong-sign background: • Fitting the angular distribution of the CCQE sample for the neutrino and anti-neutrino content • Comparing predicted to observed event rates in the CCπ+ sample • Measuring how often muon decay electrons are produced (exploits μ- nuclear capture)
Fitting the outgoing muon angular distribution • In the RFG, due to the interference term the CCQE nm s >> nm s for backward-going m BEFORE FIT DISTRIBUTIONS Scale the nm template by “an” Events Scale the nm template by “an”
Fitting the outgoing muon angular distribution • Results indicate the nm flux is over-predicted by ~30% • Fit also performed in bins of reconstructed energy; consistent results indicate flux spectrum shape is well modeled
Wrong-sign measurements • Three independent and complementary measurements of the wrong-sign background: • Fitting the angular distribution of the CCQE sample for the neutrino and anti-neutrino content • Comparing predicted to observed event rates in the CCπ+ sample • Measuring how often muon decay electrons are produced (exploits μ- nuclear capture)
CCπ+ sample formation e- • The neutrino induced resonance channel leads to three leptons above Cherenkov threshold • Primary muon • Decay electron • Decay positron m- e+ m+ Δ N π+ N
CCπ+ sample formation e- m- e+ m+ Δ π+ • Due to nuclear π- capture, the corresponding anti-neutrino interaction has only two: • Primary muon • Decay positron N e+ m+ N Δ ~100% nuclear capture π- N
CCπ+nm flux measurement • With the simple requirement of two decay electrons subsequent to the primary muon, we isolate a sample that is ~80% neutrino-induced. • Data/simulation ratios in bins of reconstructed energy indicate the neutrino flux is over-predicted in normalization, while the spectrum shape is consistent with the prediction
CCπ+nm flux measurement • With the simple requirement of two decay electrons subsequent to the primary muon, we isolate a sample that is ~80% neutrino-induced. • Data/simulation ratios in bins of reconstructed energy indicate the neutrino flux is over-predicted in normalization, while the spectrum shape is consistent with the prediction Model-independent measurement, employed by both CCQE, NCE anti-neutrino analyses
Wrong-sign measurements • Three independent and complementary measurements of the wrong-sign background: • Fitting the angular distribution of the CCQE sample for the neutrino and anti-neutrino content • Comparing predicted to observed event rates in the CCπ+ sample • Measuring how often muon decay electrons are produced (exploits μ- nuclear capture)
μ- capture measurement • We isolate a > 90% CC sample for both m-only and m+e samples • CC events typically observe both m+e - two reasons why we may not observe the decay electron: • Decay electron detection efficiency • μ- nuclear capture (nm CC events only)
μ- capture measurement • By requiring (m-only/m+e)data = (m-only/m+e)MC and normalization to agree in the m+e sample we can calculate a nm flux scale and a rate scale Predicted neutrino content in the m+e sample, for example
μ- capture measurement • By requiring (m-only/m+e)data = (m-only/m+e)MC and normalization to agree in the m+e sample we can calculate a nm flux scale and a rate scale Results: PRELIMINARY
Neutrino flux measurement summary nm content of nmbeam • Discrepancy with prediction appears to be in normalization only - flux shape is well modeled PRELIMINARY
Booster Neutrino Beam • CCQE events in MiniBooNE • MiniBooNEnm CCQE result review • nm flux in nm beam measurements • RFG model comparisons to nm CCQE data • Future BooNE CCQE measurements, conclusions
RFG model comparisons • Will show bkg-subtracted data • Purity: 64%. • Data not corrected for reconstruction biases PARTIALLY CONSTRAINED CONSTRAINED
RFG model comparisons • Will compare data to absolutely-normalized simulation under two CCQE model hypotheses: “MAH”: axial mass for hydrogen scattering, “MAC”: carbon • MAC = 1.35 GeV, k = 1.007, MAH = 1.02 GeV • MAC = MAH = 1.02 GeV k = 1.000 [1] MA = 1.35 GeV, k = 1.007 consistent with BooNE nm data MA = 1.02 GeV consistent with light target data [2] [1] • MiniBooNE, Phys. Rev. D81, 092005 (2010) [2] Bodek et al,. arxiv:hep-ex/0308005
Q2QE: shape comparison to data nm CCQE PRELIMINARY MA = 1.02 GeV, k = 1 inconsistent with data shape
Q2QE: absolute comparison with “#1” nm CCQE PRELIMINARY data/MC integrated ratio: 1.21 ± 0.12
Q2QE: absolute comparison with “#2” nm CCQE PRELIMINARY data/MC integrated ratio: 1.39 ± 0.14
EnQE: shape comparison to data nm CCQE PRELIMINARY EnQE shape insensitive to CCQE model parameters
EnQE: absolute comparison with “#1” nm CCQE PRELIMINARY data/MC integrated ratio: 1.21 ± 0.12
EnQE: absolute comparison with “#2” nm CCQE PRELIMINARY data/MC integrated ratio: 1.39 ± 0.14
Booster Neutrino Beam • CCQE events in MiniBooNE • MiniBooNEnm CCQE result review • nm flux in nm beam measurements • RFG model comparisons to nm CCQE data • Future BooNE CCQE measurements, conclusions
Future nm CCQE measurements • Absolute and differential cross section measurements, including the model-independent double differential cross section
Future nm CCQE measurements • Absolute and differential cross section measurements, including the model-independent double differential cross section Taking the difference between nmand nmdata in the Q2 distribution gives direct sensitivity to the axial form factor
Conclusions • Though MiniBooNE is unmagnetized, a model-independent statistical technique measures the nm content in the nm beam to ~15% uncertainty • Shape comparisons to data show consistency with RFG model parameters extracted from BooNE nm data, while MA = 1.02 GeV remains inconsistent with BooNE data. • Normalization discrepancy ([data-bkg]/prediction): • 1.21 ± 0.12 for MAC = 1.35 GeV, k = 1.007 MAH = 1.02 GeV • 1.39 ± 0.14 for MAC = MAH = 1.02 GeV k = 1.000 • nm CCQE data: 1.05 ± 0.08 for MA = 1.35 GeV, k = 1.007 PRELIMINARY
Conclusions • MiniBooNE will soon publish absolute and differential nm CCQE cross sections, will also use nm CCQE measurement to measure interference term in Q2 and En
More from MiniBooNE today • For new results in the MiniBooNE anti-neutrino NCE channel please see the next talk by R Dharmaplan • For a comprehensive review of MiniBooNE single pion production see R Nelson’s talk this afternoon