Genome-wide Functional Linkage Maps
430 likes | 454 Vues
Explore methods for inferring functional linkages in genomes, including Rosetta stone, phylogenetic profiles, gene neighbors, and operon methods. Learn about accuracy assessments and databases like DIP and ProLinks. Analyze parallel pathways and structural genomics with examples from seminal studies. Discover the power of hierarchical clustering in constructing functional modules and pathways. Dive into research on network interactions, energy metabolism, and biosynthesis pathways in Mycobacterium tuberculosis.

Genome-wide Functional Linkage Maps
E N D
Presentation Transcript
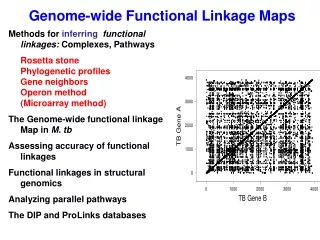
Genome-wide Functional Linkage Maps Methods for inferringfunctional linkages: Complexes, Pathways Rosetta stone Phylogenetic profiles Gene neighbors Operon method (Microarray method) The Genome-wide functional linkage Map in M. tb Assessing accuracy of functional linkages Functional linkages in structural genomics Analyzing parallel pathways The DIP and ProLinks databases
Diphtheria Toxin Dimer vs. Monomer Bennett et al., PNAS, Vol. 91, 3127-3131 (1994)
PHYLOGENETIC PROFILE METHOD Pellegrini et al (1999) PNAS 96, 4285
The Gene NeighborMethod for Inferring Functional Linkages A B A A B B genome4 genome1 genome2 genome3 C . . . C A C B C A statistically significant correlation is observed between the positions of proteins A and B across multiple genomes. A functional relationship is inferred between proteins A and B, but not between the other pairs of proteins: A C B
OPERON or GENE CLUSTER method of inferring functional linkages in the genome of Mycobacterium tuberculosis gene A bbbb gene B gene C The 100 bp threshold is chosen because it gives the broadest coverage consistent with high accuracy Research of Michael Strong
Network Interaction Map vs. Genome-Wide Functional Linkage Map vs Strong, Graeber et al. (2003) Nucleic Acid Research, 31, 7099
Figure 7. M. Strong, T. Graeber et al.
Requiring 2 or more functional linkages: 1,865 genes make 9,766 linkages
D E C B F A
D E Cluster A: 6 genes; 5 annotated 4 linkages 5 genes coding for DNA replication or repair The 6th gene inferred to be involved in DNA binding, and in fact encodes a Zn-ribbon C B F A
D E Cluster A: 6 genes; 5 annotated 5 linkages 5 genes coding for DNA replication or repair The 6th gene inferred to be involved in DNA binding, and in fact encodes a Zn-ribbon C B F None of the genes is a homolog A
D E Cluster B: 6 genes; 7 linkages 3 genes: Ser/Thr kinase or phophatase activities 2 genes: cell wall biosynth. 1 gene: unannotated C B F Gene 14, pknB (a Ser/Thr kinase) contains PASTA domains (penicillin-binding serine/threonine kinase associated) A
D E Cluster B: 6 genes; 7 linkages 3 genes: Ser/Thr kinase or phophotase activities 2 genes: cell wall biosynth. 1 gene: unannotated C B F Gene 19 is unannotated. It contains A FHA (Forkhead associated) domain, which binds phosphothreonine containing proteins. A
D E Cluster D: Links gene 50 (a penicillin binding protein involved in cell wall synthesis) to gene 51 (an integral membrane protein). C B F A
E is a functional link between gene 16 (pbkA in cell wall biosynthesis) and gene 50 (the penicillin binding protein involved in cell wall biosynthesis) E D C A F B
Some columns show similar linkages, so cluster like columns, using Eisen et al.(1998) procedure, CLUSTER
Hierarchical clustering of the TB Whole Genome Functional Linkage Map Functional modules range in size From 2 to > 100 linkages Dozens of off diagonal functional linkages Research of Michael Strong and Tom Graeber
Degradation of Fatty acids Polyketide and non- ribosomal,Degradation of Fatty acids, and Energy Metabolism Energy Metabolism, oxidoreductases Polyketide and non-ribosomal Peptide synthesis Detoxification Research of Michael Strong and Tom Graeber
Cell Envelope, Cell Division Energy Metabolism TCA Broad Regulatory, Serine Threonine Protein Kinase Cell Envelope, Murein Sacculus and Peptidoglycan Transport/Binding Proteins Transport/Binding Proteins Cations Energy Metabolism, ATP Proton Motive force Biosynthesis of cofactors Chaperones Cytochrome P450 Cell Envelope Two component systems Energy Metabolism, Anaerobic Respiration Aromatic Amino Acid Biosynthesis Sugar Metabolism Novel Group Purine, Pyrimidine nucleotide biosynthesis Biosynthesis of Cofactors, Prosthetic groups Synthesis and Modif. Of Macromolecules, rpl,rpm, rps Amino Acid Biosynthesis (Branched) Degradation of Fatty Acids Lipid Biosynthesis Emergy Metab. Respiration Aerobic Amino acid Biosynthesis Energy Metabolism, oxidoreductase Virulence Deg. of Fatty Acids Energy Metabolism, oxidoreductase Fig 4. Polyketide and non-ribosomal peptide synthesis Detoxification M. Strong, T. Graeber et al.
Cell Envelope, Cell Division Energy Metabolism TCA Broad Regulatory, Serine Threonine Protein Kinase Cell Envelope, Murein Sacculus and Peptidoglycan Transport/Binding Proteins Transport/Binding Proteins Cations Energy Metabolism, ATP Proton Motive force Biosynthesis of cofactors Chaperones Cytochrome P450 Cell Envelope Two component systems Energy Metabolism, Anaerobic Respiration Aromatic Amino Acid Biosynthesis Sugar Metabolism Novel Group Purine, Pyrimidine nucleotide biosynthesis One of 7 modules of unannotated linkages, perhaps undiscovered pathways or complexes Biosynthesis of Cofactors, Prosthetic groups Amino Acid Biosynthesis (Branched) Degradation of Fatty Acids Lipid Biosynthesis Emergy Metab. Respiration Aerobic Amino acid Biosynthesis Energy Metabolism, oxidoreductase Virulence Deg. of Fatty Acids Energy Metabolism, oxidoreductase Polyketide and non-ribosomal peptide synthesis Detoxification
HisG HisF HisI /HisI2 HisA HisH HisB HisC /HisC2 HisB HisD Pathway Reconstruction from Functional Linkages All 9 enzymes of the histidine biosynthesis pathway are linked, and are clustered separately from other amino acid synthetic pathways
Functional Linkages Among Cytochrome Oxidase Genes CtaD CtaE CtaC CtaB Functional linkages relate all 3 components of cytochrome oxidase complex and also CtaB, the cytochrome oxidase assembly factor These genes are at four different chromosomal locations Membrane proteins linked to soluble proteins
Quantitative Assessment of Inferred Protein Complexes Research of Edward Marcotte, Matteo Pellegrini, Michael Thompson and Todd Yeates
Calculating Probabilities of Co-evolution Phylogenetic Profile Rosetta Stone N= number of fully sequenced genomes n= number of homologs of protein A m = number of homologs of protein B k = number of genomes shared in common Gene Neighbor X= fractional separation of genes Operon n = intergenic separation
Combining Inferences of Co-Evolution from 4 Methods We use a Bayesian approach to combine the probabilities from the four methods to arrive at a single probability that two proteins co-evolve: where positive pairs are proteins with common pathway annotation and negative pairs are proteins with different annotation
ProLinks Database www.dip.doembi.ucla.edu/pronav ~ 10,000,000 Functional Linkages inferred from 83 fully sequenced genomes
Benchmarking this Approach Against Known ComplexesEcocyc: Karp et al. NAR, 30, 56 (2002) Research of Matteo Pellegrini For high confidence links, we find 1/3 of true interactions with only one 1/1000 of the false positive ones Random True positive interactions are between subunits of known complexes and false positive ones are between subunits of different complexes.
Example Complex: NADH Dehydrogenase I 11 of 13 subunits detected
Example Complex: NADH Dehydrogenase I 11 of 13 subunits detected 3 false positives
From Inferred Protein Linkages to Structures of Complexes Research of Michael Strong, Shuishu Wang, Markus Kauffman
The Problem of PE and PPE Proteins in M. tb PE, PE-PGRS, and PPE Proteins in M. tuberculosis 38 PE proteins; 61 PE-PGRS proteins; 68 PPE proteins Together compromise about 5 % of the genome No function is known, but some appear to be membrane bound No structure is known: always insoluble when expressed Goal: use functional linkages to predict a complex between a PE and a PPE protein: express complex, and determine its structure Research of Shuishu Wang and Michael Strong
Construction of a co-expression vector to test for protein-protein interactions (Mike Strong) gene A gene B T7 promoter lac oper. RBS RBS Thrombin site His tag Kpn1 NcoI HindIII pET 29b(+) Nde1 transcription polycistronic mRNA translation protein A protein B (with His tag) If proteins do not interact If proteins interact (protein-protein interaction) protein A protein B (with His tag) protein A protein B (with His tag)
When co-expressed, the PE and PPE proteins, inferred to interact, do form a soluble complex, Mr = 35,200 Sedimentation equilibrium experiments: Rv2430c + Rv2431c fraction 49, in 20mM HEPES, 150mM NaCl, pH 7.8 Concentration OD280 0.7, 0.45, 0.15 Expected Mr: Rv 2431c (PE) 10,687 (10563.12 from Mass Spec) Rv2430c+His tag (PPE) 24,072 (23895.00 from Mass Spec) Possibly suggests a 1:1 complex between these two proteins
Crystallization trials of the Complex Between PE Protein Rv2430c and PPE Protein Rv2431c
Database of Interacting Proteins www.dip.doe-mbi.ucla.edu • Experimentally detected interactions from the scientific literature • Currently ~ 44,000 interactions
DOE-MBI LSBMM, UCLA The DIP Database
Live DIP Gives the States of ProteinsTransitions Documented * * *
ProLinks Database and the Protein Navigator • Contains some 10,000,000 inferred functional linkages from 83 genomes • Available at www.doe-mbi.ucla.edu • Soon to be expanded to 250 fully sequenced genomes • Eventually to be reconciled with DIP
Summary Many functional linkages are revealed from genomic and microarray data (high coverage) Validity of functional linkages can be assessed by compar- ison to known complexes, and to expression data, and by keyword recovery Clustered genome-wide functional maps can reveal and organize information on complexes and pathways Functional linkages can reveal protein complexes suitable for structural studies B C A protein’s function is defined by the cellular context of its linkages Y A X V Z
Protein Interactions Analysis of M.tb. Genome Michael Strong Whole Genome Interaction Maps Michael Strong & Tom Graeber Methods of Inferring Interactions Edward Marcotte, Matteo Pellegrini, Todd Yeates Michael Thompson, Richard Llwellyn Database of Interacting Proteins Lukasz Salwinski, Joyce Duan, Ioannis Xenarios, Robert Riley, Christopher Miller Parallel pathways Huiying Li