
Chapter Outline
E N D
Presentation Transcript
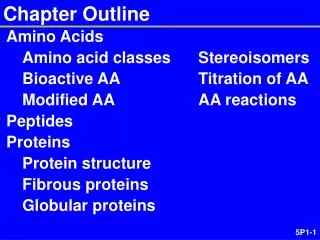
Chapter Outline • The Normal Curve • Sample and Population • Probability • Normal Curves, Samples and Populations, and Probabilities in Research Articles
Inferential Statistics • Allow us to draw conclusions about theoretical principles that go beyond the group of participants in a particular study
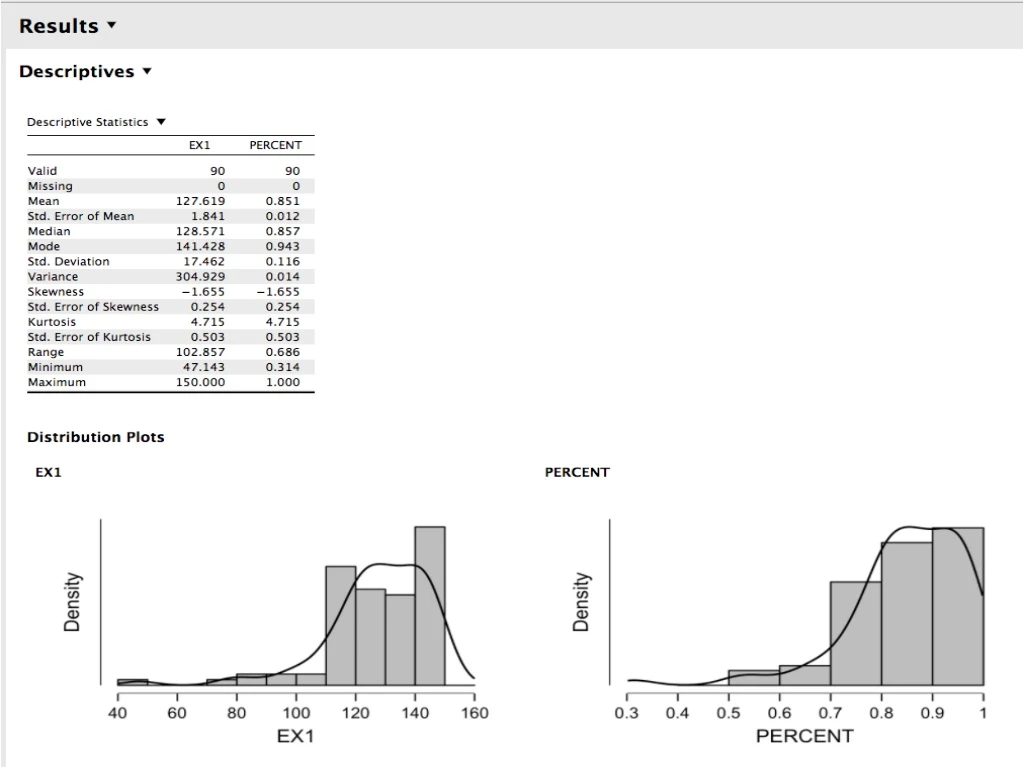
Characteristics: Normal Distribution Histogram/frequency distribution: Unimodal, symmetrical, bell-shaped Most cases near the center Fewer at the extremes A mathematical distribution Researchers compare the distributions of their variables to see if they approximately follow the normal curve Normal Curve A THEORICAL DISTRIBUTION Precisely Mathematically defined by a formula with MEAN & SD Z- scores (Mean = 0 and SD =1)
Why Normal Curve Is Commonly Found in Nature • A person’s ratings on a variable or performance on a task is influenced by a number of random factors at each point in time. • These factors can make a person rate things like stress levels or mood as higher or lower than they actually are, or can make a person perform better or worse than they usually would. • Most of these positive and negative influences on performance or ratings cancel each other out. • Most scores will fall toward the middle, with few very low scores and few very high scores. • This results in an approximately normal distribution (unimodal, symmetrical, and bell-shaped).
Each actual case influenced by many things each is essentially random. Combination of random events likely to be a middle score. When not a middle score, equal chances of an imbalance of the random influences being in either direction. Each case representing a combination of random influence producing a normal-shaped curve The Central Limit Theorem
The normal curve an exactly defined distribution If distribution normal An exact relation between Z scores & % of cases above and below it If Z score is known Can determine % of cases above or below Z score Why? Normal curve is symmetrical around Mean Normal Curve & Z scores
If a person has a Z score of 0 50% of the cases fall above and 50% fall below that person.
The area under a normal curve 50% 34% 34% 14% 14% 2% 2%
If a person has a z score of 1 34% of people have Z scores between that person and the mean 84% of people fall below that person 50 from the negative side + 34 from positive = 50+34 = 84% 16% of the people fall above the person 50% of cases above the mean = 50-34 = 16
If a person has a Z score of -1 34% of people have Z scores between that person & the mean. 16% of cases fall below that person: 50% -34% = 16% 84% of the people are above that person: 50+34 = 84%
68% of the people have Z scores between +1 and -1 Approximately 14% of cases fall between 1 and 2 SDs
If a person has a Z score of +2 14% of people have Z scores between 1 SD and 2 SD 98% of cases are below that person: 14%+34%+50% This person is in the top 2% of the cases -
If a person has a Z scores of -2: 14% of people have Z scores between that person and someone only 1 SD below the mean 2% of the cases are below that person (34+14-50) 98% of the cases are above that person. 96% of the people have a scores between +2 and -2
More examples: If a person has 50% above, what is the person’s Z? If a person has 2% above, what is the person’s Z? If a person has 2% below him, what is the person’s Z? If a person has 16% above him, what is the person’s Z? What % of people fall between the mean and a Z score of +2? What % of people fall between a Z score of +1 and a Z score of 0? What percentage of people fall between a Z score of +1 and a Z score of -2?
The Normal Curve Table and Z Scores • A normal curve table shows the percentages of scores associated with the normal curve. • The first column of this table lists the Z score • The second column is labeled “% Mean to Z” and gives the percentage of scores between the mean and that Z score. • The third column is labeled “% in Tail.” .
Population Mean = 100 Population SD = 16 IQ Information
If a person has an IQ of 125, what % of people have higher IQs? 1. Compute Z score of 125: Z = 1.56 2. Z = 1.56 = 44.06% of Curve (From TABLE!!) 3. 50 - 44.06 = 5.94% 4. Answer: 5.94% have higher Scores
What IQ score would a person need to be in top 5%? 1. There is 50% 2. Top is 5% 3. 50-5 = 45% 4. ~44.95 : Z = 1.64 (From Table!) Raw Score Formula: X = (Z)(SD)+ M --> (1.64)(16)+100: IQ = 126
If Jane was in the top 10% of her 9th Grade Students, on a creativity test, what is Jane's Z score? 1. There are 50% above the mean: 50% - 10% = 40% 2. She is above 40% 3. Look up 40% in table to determine Z-Score 4. 40% in table ~ 39.97: Z = 1.28
With an IQ of 95, what is % of people with IQ lower than this person? 1. Find Z Score: 95-100/16 = -.31 2. From Table: -.31 = 12.17% 3. 50% - 12.17% = 37.83%
What IQ would be in the Lowest 2.5%? 50-2.5 = 47.5 % -----> Z = -1.96 X = (Z)(SD)+ M ---> (-1.96)(16)+100 = 68.64
The ACME Scholarship Foundation Provides College Scholarships to the top 3% of students who take the ACME Prep Test. The Mean of the test is 78 and SD = 4 and the scores are normally distributed. If Joe received a score of 85 on the test, will he receive a scholarship? Joe's Z= 85-78/4 = 1.75 Top 3% = 50-3 = 47% ---> Z = 1.88 Z = 1.88 ----> Raw Score of 85.52 (Using Raw Score Formula)
The area under a normal curve 50% 34% 34% 14% 14% 2% 2%
Lecture 5 The 68-95-99.7 Rule