Download

1 / 25
260 likes | 420 Vues
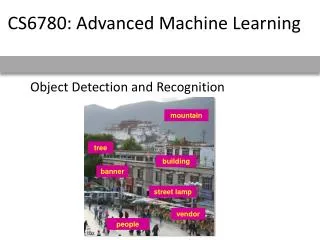
Vittorio Ferrari Loic Fevrier Frederic Jurie Cordelia Schmid. Groups of Adjacent Contour Segments for Object Detection. ?. Problem: object class detection & localization. Training. Focus : classes with characteristic shape. Testing. Features: pairs of adjacent segments (PAS).

E N D
Vittorio Ferrari Loic Fevrier Frederic Jurie Cordelia Schmid Groups of Adjacent Contour Segments for Object Detection
? Problem: object class detection & localization Training Focus: classes with characteristic shape Testing
Features: pairs of adjacent segments (PAS) Contour segment network [Ferrari et al. ECCV 2006] edgels extracted with Berkeley boundary detector 2) edgel-chains partitioned into straight contour segments 3) segments connected at edgel-chains’ endpoints and junctions
PAS descriptor: Features: pairs of adjacent segments (PAS) segments connected in the network PAS = groups of two connected segments • encodes geometric properties of the PAS • scale and translation invariant • compact, 5D
Example PAS Why PAS ? + can cover pure portions of the object boundary Features: pairs of adjacent segments (PAS) + intermediate complexity: good repeatability-informativeness trade-off + scale-translation invariant + connected: natural grouping criterion (need not choose a grouping neighborhood or scale)
PAS codebook Based on descriptors, cluster PAS into types a few of the most frequent types based on 10 outdoor images (5 horses and 5 background). types based on 15 indoor images (bottles) • Frequently occurring PAS have intuitive, natural shapes • As we add images, number of PAS types converges to just ~100 • Very similar codebooks come out, regardless of source images + general, simple features. We use a single, universal codebook (1st row) for all classes
Window descriptor 1. Subdivide window into tiles. 2. Compute a separate bag of PAS per tile 3. Concatenate these semi-local bags [Lazebnik et al. CVPR 2006]; [Dalal and Triggs CVPR 2005] + distinctive: records which PAS appear where weight PAS by average edge strength + flexible: soft-assign PAS to types rather coarse tiling + fast to compute using Integral Histograms
4. Collect negative example descriptors: slide window over negative training images Training 1. Learn mean positive window dimensions 2. Determine number of tiles T 3. Collect positive example descriptors
Training 5. Train a linear SVM Here a few of the top weighted descriptor vector dimensions (= 'PAS + tile'): + lie on object boundary (= local shape structure common to many training examples)
Testing 1. Slide window of aspect ratio , at multiple scales 2. SVM classify each window + non-maxima suppression detections
(missed and FP) Results – INRIA horses Dataset: ~ Jurie and Schmid, CVPR 2004 170 positive + 170 negative images (training = 50 pos + 50 neg) wide range of scales; clutter + tiling brings a substantial improvement optimum at T=30 -> keep this setting on all other experiments + works well: 86% det-rate at 0.3 FPPI (with 50 pos + 50 neg training images)
(missed and FP) Results – INRIA horses Dataset: ~ Jurie and Schmid, CVPR 2004 170 positive + 170 negative images (training = 50 pos + 50 neg) wide range of scales; clutter + PAS better than any IP all interest point (IP) comparisons with T=10, and 120 feature types, (= optimum over INRIA horses, and ETHZ Shape Classes; all IP codebooks are class-specific)
Results – Weizmann-Shotton horses Dataset: Shotton et al., ICCV 2005 327 positive + 327 negative images (training = 50 pos + 50 neg) no scale changes; modest clutter Shotton’s EER - exact comparison to Shotton et al.: use their images and search at a single scale - PAS same performance (~92% precision-recall EER), but: + no need for segmented training images (only bounding-boxes) + can detect objects at multiple scales (see other experiments)
Results – ETHZ Shape Classes Dataset: Ferrari et al., ECCV 2006 255 images, over 5 classes training = half of positive images for a class + same number from the other classes (1/4 from each) testing = all other images large scale changes; extensive clutter
Missed Results – ETHZ Shape Classes Dataset: Ferrari et al., ECCV 2006 255 images, over 5 classes training = half of positive images for a class + same number from the other classes (1/4 from each) testing = all other images large scale changes; extensive clutter
Apple logos Bottles Giraffes Mugs Swans Results – ETHZ Shape Classes + mean det-rate at 0.4 FPPI = 79% + class specific IP codebooks + PAS >> I.P for apple logos, bottles, mugs PAS ~= IP for giraffes (texture!) PAS < IP for swan + overall best IP: Harris-Laplace
Results – Caltech 101 Results – Caltech 101 Dataset: Fei-Fei et al., GMBV 2004 42 anchor, 62 chair, 67 cup images train = half + same number of caltech101 background testing = other half pos + same number of background scale changes; only little clutter
Results – Caltech 101 Dataset: Fei-Fei et al., GMBV 2004 On caltech101’s anchor, chair, cup: + PAS better than Harris-Laplace + mean PAS det-rate at 0.4 FPPI: 85%
Apple logos Bottles Giraffes Mugs Swans Comparison to Dalal and Triggs CVPR 2005
INRIA horses Shotton horses Caltech anchors Caltech chairs Caltech cups Comparison to Dalal and Triggs CVPR 2005 + overall mean det-rate at 0.4 FPPI: PAS 82% >> HoG 58% PAS >> HoG for 6 datasets PAS ~= HoG for 2 datasets PAS < HoG for 2 datasets
Generalizing PAS to kAS kAS: any path of length k through the contour segment network segments connected in the network 4AS 3AS • scale+translation invariant descriptor with dimensionality 4k-2 • k = feature complexity; higher k -> more informative, but less repeatable kAS • overall mean det-rates (%) 1AS PAS 3AS 4AS 0.3 FPPI 69 77 64 57 0.4 FPPI 76 82 70 64 PAS do best !
Conclusions Connected local shape features for object class detection Experiments on 10 diverse classes from 4 datasets show: + bettersuited than interest points for these shape-based classes + PAS have the best intermediate complexity among kAS + object detectordeals with clutter, scale changes, intra-class variability + object detector compares favorably to HoG-based one - fixed aspect-ratio window: sometimes inaccurate bounding-boxes - single viewpoint
Model • collection of PAS and their spatial variability • only common boundary Current work: detecting object outlines Training: learn the common boundaries from examples
3. vote for translation + scale initializations 4. match deformable thin-plate spline based on deterministic annealing Outline object in test image, without segmented training images ! Current work: detecting object outlines Detection on a new image 1. detect edges 2. match PAS based on descriptors