
Uploaded by
vian
0 SLIDES
265 VUES
1LIKES
Return On Working Capital Handbook
DESCRIPTION
Return On Working Capital Handbook. Structure of Handbook. This handbook has been created to help users to construct a ROWC model It starts by explaining the importance of ROWC as a business measure together with the quick calculation We then move on to the ROWC model with its 5 drivers
Download

1 / 0
Download Presentation

Télécharger la présentation
Return On Working Capital Handbook
An Image/Link below is provided (as is) to download presentation
Download Policy: Content on the Website is provided to you AS IS for your information and personal use and may not be sold / licensed / shared on other websites without getting consent from its author.
Content is provided to you AS IS for your information and personal use only.
Download presentation by click this link.
While downloading, if for some reason you are not able to download a presentation, the publisher may have deleted the file from their server.
During download, if you can't get a presentation, the file might be deleted by the publisher.
E N D
Presentation Transcript
- Return On Working Capital Handbook
- Structure of Handbook This handbook has been created to help users to construct a ROWC model It starts by explaining the importance of ROWC as a business measure together with the quick calculation We then move on to the ROWC model with its 5 drivers Gross margin Cost structure Inventory days Days sales outstanding Days purchases outstanding There are explanations for each driver on the subsequent pages
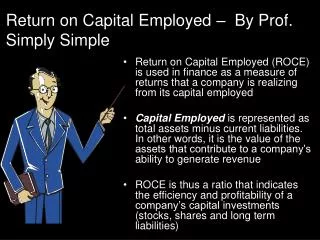
- Return on working capital (“ROWC”) Return on Working Capital Operating Profit Working Capital ROWC is one of the most important measures for a business. It reflects for any business the: Total business opportunity of the market focus Strength of the value proposition Quality of asset and resource management Ability to negotiate with customers for value not price Ability to be rewarded for value by suppliers Barriers to entry in a given industry Competitive advantages Threat of being substituted
- ROWC modelTogether with an example Return on Working Capital ROWC is a multiplication of Operating Margin (determined by the profit model) and Working Capital Turn (determined by the working capital model) 7.14% Working Capital Turn measures how many times per year working capital turns x Working Capital Turn Operating Margin 7.14 1% Working Capital Days measures the time it takes between paying a supplier and receiving cash from the customer Working Capital Days Operating Margin is the difference between Gross margin and Cost structure 51.1 Days Sales Outstanding Days Purchases Outstanding Inventory Days Gross Margin Cost Structure - - + + 29.2 36.5 43.8 5% 4%
- Financial Statements to ROWC Two financial statements, the income statement and the balance sheet can be simplified into the following formats From these financial statements, the ROWC model can be constructed.
- Gross Margin = 5% Key definitions Net sales represent invoices to resellers net of any returns Cost of sales includes the direct costs of the product and/ or service that has been invoiced to resellers. For a distributor this is typically the vendor costs of the product net of any rebates that are directly passed through to the reseller Performance rebates are those incentives paid by vendors that should be protected by the distributor and form part of their profitability Measure Gross margin measures the value delivered to the customer that the customer is willing to pay for Gross Margin Gross Profit Sales
- Cost structure = 4% Key definitions Sales, General and Administrative (“SG&A”) costs include the following costs of a distributor: Sales Marketing Logistics Occupancy, including warehousing Technology Corporate, finance and administration SG&A does not include interest, tax and extraordinary items costs SG&A does not include those costs that have been included in cost of sales Measure Cost structure measures the productivity of the various processes in the distributor, the key process being sales Cost Structure SG & A Costs Sales
- Operating Margin Operating Margin 1% Gross Margin Cost Structure - 5% 4% Key definitions The difference between gross margin and cost structure Measure The return on sales or the difference between value and productivity
- Inventory days Inventory Days = 36.5 days Inventory x 365 Sales Key definitions Included in inventory are: Goods held for resale Goods In Transit Work in Progress Spares Measure Number of days of working capital tied up in inventory
- Days Sales Outstanding (“DSO”) DSO = 43.8 days Receivables x 365 Sales Measure The number of days credit provided to customers usually dictated by Terms and Conditions Key definitions The time it takes between the date of the invoice to customer and receiving the cash
- Days Purchases Outstanding (“DPO”) DPO = 29.2 days Payables x 365 Sales Measure The number of days credit provided by suppliers usually dictated by Terms and Conditions Key definitions The time it takes between the date of the invoice from the supplier and paying the invoice Netted off Accounts Payable can be the amounts owed by the supplier to the business (rebates etc)
- Working Capital Turns and Days Working Capital Turns 7.14 Working Capital Days 51.1 Inventory Days DSO DPO - + 29.2 36.5 43.8 Measure The faster you turn working capital the better from both a cost and ROWC aspect The lower the working capital days the better as long as you do not compromise the value proposition Key definitions Working Capital Turn measures how many times per year working capital turns Working Capital Days measures the time it takes between paying a supplier and receiving cash from the customer
- Return on Working Capital 7.14% x Working Capital Turn Operating Margin 7.14 1% Working Capital Days 51.1 Days Sales Outstanding Days Purchases Outstanding Inventory Days Gross Margin Cost Structure - - + 29.2 36.5 43.8 5% 4% ConclusionROWC – The Business Model Every company is different Easy visual to understand the model Can be benchmarked Best practices can improve performance


More Related
Audio
Live Player