Download
1 / 83
830 likes | 938 Vues
Explore global energy consumption, oil production, fossil fuels' impact, efficiency, new tech, alternative sources, and future trends. Learn about climate change, air pollution effects, and ways to combat challenges.

E N D
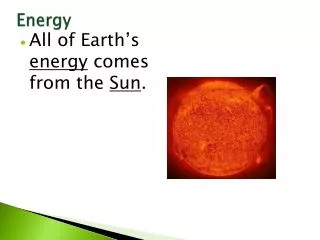
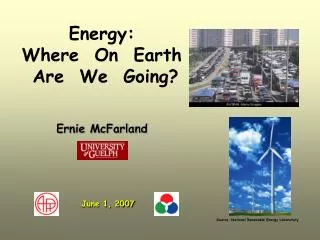
Energy: Where On Earth Are We Going? Ernie McFarland June 1, 2007 Source: National Renewable Energy Laboratory
With thanks to: Iain Campbell (University of Guelph) Jim Hunt (University of Guelph) Al Bartlett (University of Colorado) Tom Kehn (University of Guelph) Dugan O’Neil (Simon Fraser University)
OVERVIEW ● Present world energy consumption ● U.S. and world oil production ● Fossil fuels: Climate change & air pollution ● Energy efficiency ● Some new technologies ● Other energy sources ● Where on Earth are we going?
Photo Source: archaeologyinfo.com Primitive Humans: 2000-3000 Calories per day or about 10 MJ/day
Sources: BP Statistical Review of World Energy June 2006; U.S. Census Bureau
Sources: BP Statistical Review of World Energy June 2006; U.S. Census Bureau
World Energy Consumption 1860-2005 Photo source: www.worldofstock.com
Sources: BP Statistical Review of World Energy 2006, US Dept. of Energy, World Energy Council
OVERVIEW ● Present world energy consumption ● U.S. and world oil production ● Fossil fuels: Climate change & air pollution ● Energy efficiency ● Some new technologies ● Other energy sources ● Where on Earth are we going?
M. King Hubbert (1903-1989) Photo Source: www.hubbertpeak.com/hubbert/
Major oil exporters to US: Canada, Mexico, Saudi Arabia, Venezuela, Nigeria, Iraq
If world oil production is going to peak soon, what about using natural gas and coal?
Fossil Fuel Reserves and Resources (exajoules) not including oil shales, gas hydrates, etc. * Highly uncertain Sources: World Energy Council, U.S. Energy Information Administration, BP Statistical Review of World Energy 2005, Canadian Assoc’n. of Petroleum Producers.
OVERVIEW ● Present world energy consumption ● U.S. and world oil production ● Fossil fuels: Climate change & air pollution ● Energy efficiency ● Some new technologies ● Other energy sources ● Where on Earth are we going?
Greenhouse Effect Source: NASA
377 ppmv in 2006 Year Source: A. Neftel, H. Friedli, E. Moor, H. Lötscher, H. Oeschger, U. Siegenthaler, B. Stauffer Physics Institute, University of Bern, CH-3012 Bern, Switzerland http://cdiac.esd.ornl.gov/trends/trends.htm
Source: World Data Center for Atmospheric Trace Gases, U.S. Department of Energy http://cdiac.esd.ornl.gov/pns/current_ghg.html
Temp. (deg.C) 0.0 corresponds to 1961-1990 avg. Solid curve is moving 5-yr avg Source: Climatic Research Unit, University of East Anglia, UK Ss Source Source: Climatic Research Unit, University of East Anglia, UK
Climate Change Source: Intergovernmental Panel on Climate Change 2007, Working Group Reports ● increase in average temperature of approx. 0.2oC per decade for next two decades ● larger temperature increase in polar areas ● thawing of permafrost and ice ● rise in sea level (0.2 – 0.6 m) by 2090-2099 ● shifting of ranges of forests, fisheries, & agriculture more extreme weather (seen already): ● increase in precipitation, especially heavy precipitation ● more droughts and flash floods in dry areas ● more extremely hot days, fewer extremely cold days
1994 Chacaltaya glacier, Bolivia 2005 Photo Source: National Geographic June 2007
Fossil-fuel-burning produces climate change. But it produces other air-pollution problems too!
Ontario Medical Association Report June 2005 ● More than 5800 people in Ontario die prematurely every year from air pollution. ● Combined healthcare and lost productivity costs are well over a billion dollars. ● Approx. 17,000 Ontarians are admitted to hospitals annually with health problems related to air pollution exposure.
What To Do About Climate Change & Air Pollution?? ● increase energy efficiency (conservation) ● explore new technologies (for coal-burning, for example) ● change to non-polluting energy sources ●prepare for warmer climate and wilder weather
The University of Nebraska’s energy extension service reports the following energy-saving suggestions proposed by elementary school children. ● Dip everything that is made in stuff that glows in the dark. ● Put more hot sauce in the food. ● Make it a rule that there has to be at least two people in every big bed that uses an electric blanket. ● Don’t stay in more than one room at a time.
Efficiency of energy conversions 60-watt lightbulb
Lighting Efficiencies Tungsten incandescent 5% Halogen bulb 7% Light-emitting diode (LED) 10% Fluorescent 20%
Globe & Mail, April 26, 2007 “Canada to ban traditional light bulbs” If all the households in Canada replace incandescent bulbs with fluorescent bulbs, it would be “the same as taking more than 1 million cars off the road.”
What would be the actual reduction in CO2 emissions annually in Canada, and how many cars would have to be taken off the road to achieve the same reduction?
2004 Source: Natural Resources Canada 1990 Grand total residential Canadian energy use increased from 1.29 EJ to 1.42 EJ from 1990 to 2004.
12,375,000 households in Canada 28% of electrical energy in Canada comes from conventional thermal stations. (→ CO2) Assume 5% loss in power lines.
Efficiency of Generating Electricity (major sources today) Photos: Ontario Power Generation
Disorder and Order
Fossil-Fuel Plant Efficiency = 40% remaining 60% of the energy waste heat
Energy content of coal = 30 million J/kg → Using incandescent bulbs for Canadian residential lighting requires 1.6 million tonnes of coal, which produce 5.7 million tonnes of CO2. Using fluorescent bulbs gives a reduction of 75%, i.e., a reduction of 4.3 million tonnes of CO2.
Annual CO2 emissions per car? 20000 km annually 10 L per 100 km therefore 2000 L of gasoline → produces 4.5 tonnes of CO2
How many cars would have to be taken off the road to achieve the same reduction in CO2 emissions as by using fluorescent bulbs?
Increasing transportation-energy efficiency Drive a smaller vehicle Buy a hybrid car Use public transit, bicycle, or walk Drive more slowly