Download
1 / 17
170 likes | 192 Vues
Learn how scientists gather data and use different map projections to represent Earth's surface accurately. Discover how to read keys, legends, and scales on maps.

E N D
Section 2: Mapping Earth’s Surface Preview Key Ideas How Scientists Make Maps Map Projections Reading a Map Information on Maps
Key Ideas • Explaintwo ways that scientists get data to make maps. • Describethe characteristics and uses of three types of map projections. • Summarizehow to use keys, legends, and scales to read maps.
How Scientists Make Maps • Because most globes are too small to show details of Earth’s surface, such as streams and highways, a great variety of maps have been developed for studying and displaying detailed information about Earth. • The science of making maps is called cartography. Scientists who make maps are called cartographers. • Cartographers use data from a variety of sources, such as from field surveys and remote sensing. • remote sensingthe process of gathering and analyzing information about an object without physically being in touch with the object
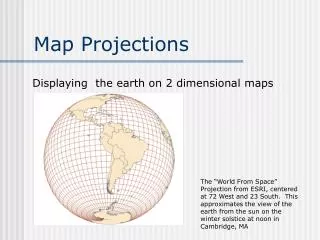
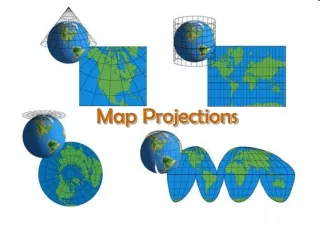
Map Projections • A map is a flat representation of Earth’s curved surface. • Transferring a curved surface to a flat map results in a distorted image of the curved surface. An area shown on a map may be distorted in size, shape, distance, or direction. • Over the years, cartographers have developed several ways to transfer the curved surface of Earth onto flat maps. These methods are called map projections. • map projection a flat map that represents a spherical surface • No map projection is entirely accurate, but each kind of projection has advantages and disadvantages.
Map Projections, continued Cylindrical Projections • If you wrapped a cylinder of paper around a lighted globe and traced the outlines of continents, oceans, parallels, and meridians, a cylindrical projection would result. • A cylindrical projection is accurate near the equator but distorts distances and sizes near the poles. • One advantage to cylindrical projections is that parallels and meridians form a grid, which makes locating positions easier. • On a cylindrical projection, shapes of small areas are usually well preserved.
Map Projections, continued The diagram below shows a cylindrical projection.
Map Projections, continued Reading Check Why do meridians and parallels appear as a grid when shown on a cylindrical projection? Because both the parallels and the meridians are equally spaced straight lines on a cylindrical projection, the parallels and meridians form a grid.
Map Projections, continued Azimuthal Projections • A projection made by placing a sheet of paper against a globe such that the paper touches the globe at only one point is called an azimuthal projection. • On an azimuthal projection, little distortion occurs at a the point of contact, but the unequal spacing between parallels causes a distortion in both direction and distance that increases as distance from the point of contact increases. • One advantage of azimuthal projections is that on these maps, great circles appear as straight lines. Thus, azimuthal projections are useful for plotting navigational paths.
Map Projections, continued The diagram below shows an azimuthal projection.
Map Projections, continued Conic Projections • A projection made by placing a paper cone over a lighted globe so that the axis of the cone aligns with the axis of the globe is known as a conic projection. • Areas near the parallel where the cone and the globe are in contact are distorted least. • A series of conic projections can be used to increase accuracy by mapping a number of neighboring areas and fitting the adjoining areas together to make a polyconic projection. • On a polyconic projection, the relative sizes and shapes of small areas on the map are nearly the same as those on the globe.
Map Projections, continued The diagram below shows a conic projection.
Reading a Map • Maps provide information through the use of symbols. Direction on a Map • Maps are commonly drawn with north at the top, east at the right, west at the left, and south at the bottom. • Some maps use parallels of latitude and meridians of longitude to indicate direction and location. • Many maps also include a compass rose, which is a symbol that indicates the cardinal directions (north, east, south, and west), or an arrow that points to geographic north.
Reading a Map, continued Symbols • Symbols are commonly used on maps to represent features such as cities, highways, rivers, and other points of interest. • Symbols may resemble the features that they represent, or they may be more abstract. • Symbols are commonly explained in a legend. • legend a list of map symbols and their meanings
Information on Maps Click below to watch the Visual Concept.
Reading a Map, continued Map Scales • scale the relationship between the distance shown on a map and the actual distance • Map scales are commonly expressed as graphic scales, fractional scales, or verbal scales. • A graphic scale is a printed line that has markings that represent units of measure, such as meters or kilometers. • A fractional scale is a ratio that indicates how distance on Earth relates to distance on the map. • A verbal scale expresses scale in sentence form.
Reading a Map, continued Reading Check Name three ways to express scale on a map. By using a graphic scale, or a printed line divided into proportional parts that represent units of measure; a fractional scale, in which a ratio shows how distance on Earth relates to distance on a map; or a verbal scale, which expresses scale in sentence form
Reading a Map, continued Isograms • isogram a line on a map that represents a constant or equal value of a given quantity • The second part of the word, -gram, can be changed to describe the measurement being graphed. For example, when the line connects points of equal temperature the line is called an isotherm. When the line connects points of equal atmospheric pressure, the line is called an isobar. • Isograms can be used to plot many types of data, such as atmospheric pressure, temperature, precipitation, gravity, magnetism, density, elevation, or chemical composition.