Download
1 / 19
190 likes | 306 Vues
This analysis explores the significance of commuting data in rural policy formulation, focusing on interdependencies between rural towns, villages, and populations as land-based sectors decline. It highlights insights into sustainability, productivity growth drivers, and challenges faced in coding workplace and travel mode information in Census data. The analysis addresses the limitations posed by small cell adjustments in rural areas and the complexities of accurately capturing commuting patterns and environmental impacts, underscoring the relevance of reliable commuting analytics for effective rural policy.

E N D
Rural Analyses of Commuting Data Martin Frost Centre for Applied Economic Geography Birkbeck College, London
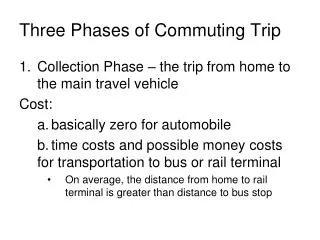
The importance of commuting analyses for rural policy • A key source of evidence on the inter-dependencies between towns, villages and dispersed populations in rural areas as the role of a place centred land-based sector declines in relative importance • A source of evidence for inter-dependencies that cross the traditional ‘urban-rural’ divide • Significant for insights into sustainability that the environmental footprint of these journeys have • Significant for analysis of the drivers of productivity growth in rural areas
Four facets of commuting evidence based on Census records • The challenge of coding workplace and mode of travel information • The issue of small cell adjustment of Census counts • The limitations and implications of table specifications at different areal scales • The problems of approximating ‘settlements’ from aggregations of Output Areas and Wards • These issues hold for all commuting analyses – but often have a greater impact on rural analyses because of relatively sparse flowsand small settlements
Workplace coding in the Census (2001) • All hinges of the Census Form question - • ‘What is the address of the place where you work in your main job?’ • Census Quality Report suggests that ‘Respondent difficulties’ included • ‘respondents who have put down a part-time job, people who have more than one occupation and those who were unsure as to which was their main job’ • ‘Item non-response’ was 7.8% - a few estimated from ‘Method of Travel’ question but 6.4% imputed • Coding relies on using an identifiable postcode in the address response
Workplace coding in the Census (2001) • A little more worrying was that ONS checks on the accuracy of automatic scanning of Census forms (contracted out to Lockheed Martin) showed them to be 86.1% accurate compared with an agreed target of 94.5% • Although ONS claim that many were affected by ‘impossible’ postcodes in only the final two characters of the code • In addition is the problem of households with more than one address • Plus the growing problem of irregular patterns of travel to multiple workplaces (about which we know very little)
Mode of travel coding in the Census (2001) • ‘Respondent difficulties’ included • ‘the most common was the use of different methods of travel on different days. Other respondents used two methods of travel and ticked more than one. A number of respondents mentioned the method of transport they used in the course of their work.’ • Item non-response was 6.3% with 5.0% ultimately imputed • Accurate data capture accuracy was high at 99.3% reflecting the ‘tick box’ nature of the Census Form response
The products of coding difficulties • The possible sources of error may occur independently but can also interact to produce ‘improbable’ journeys • Intuitively, it seems to many experienced users of Census work travel data that these problems have a stronger influence in 2001 than before • Some of this may be that people’s lives and journeys are becoming more complicated and more dispersed • Some may be the result of coding difficulties • The ‘improbable’ journeys can have a significant influence of average and median journey distances – particularly for individual modal groups – and on estimates of ‘environmental impacts’ of travel
Long journeys matter in rural areas But about 7 million person kms of car commuting contributed by people who state they drive more than 150kms (each way per day??)
Possible ‘cut-offs’ for ‘improbable’ journeys • One approach is to use National Travel Survey data to estimate speeds of commuting travel by mode – and then apply ‘common sense’ upper limits • In some work we have applied a three hour cut-off. • But…. this would eliminate all the journeys of more than 150kms included on the previous slide
Numbers commuting from London by Underground People (per Output Area) 3 4 5 6 7 - 13
The issue of small cell adjustment • Travel to work tables (particularly for small areal units such as Output Areas or Wards) are notoriously sparse • To maintain anonymity small cell adjustment sets any values of 1 or 2 travellers between any pair of areas to either 0 or 3 • The effect is constrained to be neutral over the total extent of any table – but it may not be neutral for individual origins or destinations • The positive side is that all previous Censuses measure work travel on a 10% sample of returns
Small cell adjustment – a simple test • Travel between North Hertfordshire and London estimated by adding up all constituent Output Areas, Wards and treating Local Authority as a whole • Output Areas 5,735 9.6% of employed residents • Wards 5,840 9.8% • Local Authority 5,692 9.7%
Table specifications • One big issue for the work travel analysis of relatively small places – there is no male/female breakdown of travellers at the Output Area scale • We know that there are still significant differences between the average journey lengths of men and women (male journeys tend to be longer across almost all labour market sub-groups) • Analyses including a gender component are forced to approximate settlements (rather badly) by ward level definitions – emphasises issue of approximating settlement boundaries
Divergence between settlement boundaries and output area approximations: Suffolk
Divergence between settlement boundaries and output area approximations: Bury St Edmunds
Divergence between settlement boundaries, output area and ward approximations: Bury St Edmunds
The effects on rural analyses of work travel • Often limited to using ward-level approximations of settlements • A particularly severe problem for the current definitions of what is ‘rural’ • Difficult to use travel distances to estimate environmental impact of travel as mode groups often have inflated average and median distances • Difficult to map ‘catchment areas’ around settlements • Partly because travel directions and links are very complex • Partly because small cell adjustment can have significant influence of relatively small settlements • Difficult to focus on the characteristics of individual settlements
But……strategic views are still viable – the changing pattern of commuting, 1981-2001(% change in commuters)
Concluding comments • Many of the data quality issues are difficult to quantify – and lead to considerable uncertainty particularly at local scales • It is highly uncertain whether environmental impacts of commuting and urban form/expansion can be adequately tackled – which is a pity • Analyses work best when meaningful aggregation is possible - but the ONS classification of rural areas (which has an upper settlement size limit of 10k residents) will usually need to be extended to include a classification of ‘urban’ as well as ‘rural’ settlements • At a ‘strategic’ level these ageing results are still relevant – it’s a long time before the 2011 data will be available!