Download

1 / 113
1.14k likes | 1.3k Vues
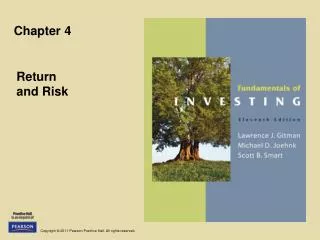
Lecture 7: Return & Risk. C. L. Mattoli. Intro. We have discussed the inputs of returns, including, maturity, inflation, and risks. Moreover, we have been using RRR’s, but we have said little, so far, about how they are determined for a particular investment.

E N D
Lecture 7:Return & Risk C. L. Mattoli (c) Red Hill Capital Corp. 2009
Intro • We have discussed the inputs of returns, including, maturity, inflation, and risks. • Moreover, we have been using RRR’s, but we have said little, so far, about how they are determined for a particular investment. • In order to explore this question, more fully, we will have to quantify risk. • Then, we can take a closer look at returns and their relationship to risk. (c) Red Hill Capital Corp. 2009
Intro • We start out, following chapter 10, looking at the historical record of Australian Capital markets. • From that study, we will be able to get a handle on the possibilities for returns, in the real world. • One conclusion will be that there is a reward for bearing risk, and the greater the risk, the more the return that will be expected from bearing that risk. • In the text book: read chapters 10 and 11. (c) Red Hill Capital Corp. 2009
Learning outcomes • On successful completion of this module you should be able to: • calculate the return on an investment • discuss the historical returns on various important types of investments • calculate the risk of an investment • discuss the historical risks on various important types of investments (c) Red Hill Capital Corp. 2009
Learning outcomes • calculate the (arithmetic and geometric) average of a series of returns • discuss concept of market efficiency • calculate expected returns and variance for an individual security and a portfolio • discuss impact of diversification • explain security market line and the risk-return trade-off. (c) Red Hill Capital Corp. 2009
Return • As noted earlier, in the course, return on investment is how much money you make on the investment. • That return is comprised of two components: • Some sort of cash income payments, like dividends on stock or interest from bonds, or other cash flows from other investments, and (c) Red Hill Capital Corp. 2009
Return • A capital gain or loss from increased of decreased value of your investment holding. • $ Return = Income + CG (capital gain/loss) • The holding period rate of return will be the total return on investment divided by the initial investment. HPR = [INC + CG]/IIO = INC/IIO + CG/IIO = Income yield + capital gains yield. • That can be converted to an annual rate for comparison to other returns. (c) Red Hill Capital Corp. 2009
Example Returns • Suppose ABC stock shares are currently selling in the market at $25, and you purchase 100 shares. • Then, your initial investment out flow is (100 shares)x($25/share) = $2,500. • Assume, during the year, the stock pays $1.50/share in dividends (D). So, your income = $1.50/share x 100 shares = $150. (c) Red Hill Capital Corp. 2009
Example Returns • Also, at the end of the year, the shares are selling in the market for $26/share. Your investment is worth $26/share 100shares = $2600. • That means that the difference in value of your shares is – Pbegin = CG = $2600 - $2500 = $100. • If you sell your shares you will have a realized capital gain; if you keep them, you will have a unrealized capital gain, a paper gain (a gain, on paper, but not in cash flow). (c) Red Hill Capital Corp. 2009
Example Returns • Your $return = INC + CG = $150 + $100 = $250. • If you sold the shares, then, you would have total cash in hand of cash inflow = income + sale of stock = $150 + $2600 = $2750. • You can figure out your simple holding period rate of return (HPR) as follows. • HPR = (Cash Inflow – cash outflow)/cash outflow = (cash inflow – investment outflow)/investment outflow = $2750 – $2500)/$2500. (c) Red Hill Capital Corp. 2009
Example Returns • Rewriting, HPR = [(INC + Pend)– Pbegin ]/Pbegin = [INC +CG]/IIO = 10.0%. • Breaking that up between the two components of return, we have HPR = income yield + capital gain yield = $150/$2500 + $100/$2500 = 6% + 4%. • In the case of dividends, the first component is called the dividend yield, as we learned in an earlier module. (c) Red Hill Capital Corp. 2009
Return Origins: RRR (c) Red Hill Capital Corp. 2009
The Build up: to date • Person gives up current consumption and saves. • He requires a return for his trouble (RRR) • Wants to be able to consume more with the money when he gets it back, in the future. • Thus, RRR will include inflation, to maintain his buying power, plus a real return. (c) Red Hill Capital Corp. 2009
The Build up: to date • Money comes in future CF (FCF), and the future is uncertain. • As a result, there must also be at least two other components of RRR’s: term structure and risk. • First, there will be a term to maturity part, and, usually, the farther until payment, the higher the required return. • There are several logical reasons to assume that it should be that way. (c) Red Hill Capital Corp. 2009
The Build up: to date • The farther out the future payment, the higher the probability that you will not get paid. • Also, as it turns out, mathematically, the farther out the payment, the more sensitive the PV of that future CF will be to changes in interest rates (YTM’s) • Second, there is risk of not getting paid, any time you get a promise of future payment. (c) Red Hill Capital Corp. 2009
Term & Risk structure of Interest Rates (c) Red Hill Capital Corp. 2009
Securities, RRR and Risk • So far, we have covered risk, lightly, and it is the major topic of this module, but lets take a look at everything we have learned, logically. • Ok, given that people invest their savings, some will invest in the securities of companies. • Remember, it’s not that mysterious: securities are pieces of paper that a company hands out to evidence borrowing = loans [bonds, notes, bills, debentures] or equity = ownership [stocks]. (c) Red Hill Capital Corp. 2009
Securities, RRR and Risk • Companies start out with nothing; then, they get money to start their business by issuing securities to investors. • Then, the company invests the money in business projects. • Investors determine the price they pay for the securities, which, theoretically, is PV of FCF as PV = DFCF, using a discounting RRR to get the price, PV. (c) Red Hill Capital Corp. 2009
Securities, RRR and Risk • Investors, in aggregate, in the markets, determine what the proper RRR’s are for companies’ securities. • We know that, in general, RRR = inflation+realreturn+termstructure+risk. • The term structure part will depend on, for example, when a bond matures and also if it makes intermediate coupon interest payments because then the risk of not getting paid is moderated by intermediate payments. • The bigger question is: how do they factor in risk in RRR? (c) Red Hill Capital Corp. 2009
Risk, RRR and Company X • Lets look at the securities of a mythical company X. • Suppose it issues one bond (means one series, not 1 single piece of paper) and common ordinary shares of stock. • First of all, debt is always less risky than stock for several reasons. • Debt has a maturity/stock does not; (c) Red Hill Capital Corp. 2009
Risk, RRR and Company X • Debt payments have to be paid or the company will be in default of the debt contract, and debt holders can take the company to court and even bankruptcy. • Stock has no payment obligations. • If the company liquidates or is forced into bankruptcy, debt holders get paid before equity stock holders. (c) Red Hill Capital Corp. 2009
Risk, RRR and Company X • The bottom line is that the markets will look at the company and its businesses and determine the perceived risk of the company. • That will lead the markets to pick and apply an appropriate RRR to the company, call it RRRX. • Then, suppose that the capital structure of the company is WD + WE =100%, WD percent debt, and WE percent equity. (c) Red Hill Capital Corp. 2009
Risk, RRR and Company X • The markets will then take RRRX and use it to figure out RRRD and RRRE, and RRRX = WDRRRD+WERRRE. • That will be the essence of cost of capital in an upcoming module. • In fact, we used that, implicitly, in the last module when we evaluated projects. • So, lets take a further look at that. (c) Red Hill Capital Corp. 2009
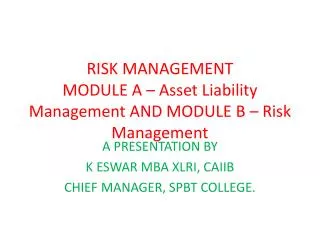
Pictures • We summarize the corporation, in terms of the cash flows that we discussed, in this chapter. Company gets money by issuing securities Financial markets Invest in and value firm Firm invests money in assets Reinvestment CF from assets Payments to security holders Stakeholders Government (c) Red Hill Capital Corp. 2009
CF from A=CF to debt+ CF to stock • One final connection: CF from A. • CF has to come from assets, including plant & WC. • The corp. does its business which includes investment and divestment of assets. • Then CF can go to: investment in PP&E & WC. • In the Op CF part of CF from A, we omit interest payments because they are outside of operations. (c) Red Hill Capital Corp. 2009
CF from A=CF-to-debt+CF-to-stock • They come after along with payments to other people who gave the company $, including ordinary and pfd stockholders. • In fact, the CF from assets is FCF: everything is done except financing transactions, like paying interest to bonds & dividends to SH. • So, after the company does its business, including selling, paying off costs and investing in itself, it has to pay the investors in bonds and stock. • Before the end of it all, too, the company can issue other issues of bonds and more stock. (c) Red Hill Capital Corp. 2009
Table 2.5 from text book: CF identity (c) Red Hill Capital Corp. 2009
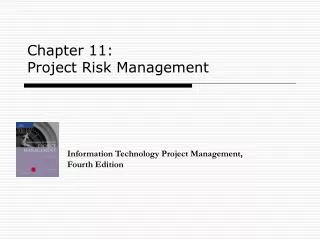
CF from A=CF-to-debt+CF-to-stock • So, the final component of the other side of the equation is taking in more money from new investors in new securities in the primary market. • In the end, on one side you get CF from assets; then, you use the FCF to pay off old investors (COC), and you might need more inflows from new investors. • We show a picture of the corporate machine, in the next slide. (c) Red Hill Capital Corp. 2009
The Corporate Machine Business Projects Markets Securities Markets Interest Investors in securities Businesses Reinvestment Dividends EPS Inventory PP&E Cash Funding Securities Issued Return on Corporate Investment Cash & Physical Assets Debt Equity Debt Equity Cash (c) Red Hill Capital Corp. 2009
RRR and the Company • The RRR of the firm’s securities, bonds and stock, is determined by the markets of people who buy them (primary markets). • Remember that on the other side of that transaction, investors giving $ to co. for securities, the company has to pay that RRR to investors. • For example, suppose a company issues $10 million in bonds that pay a 10% annual coupon for 10 years, and investors RRRD is higher than 10%, so they give the company less than $10 million. (c) Red Hill Capital Corp. 2009
RRR and the Company • Suppose that the investor’s RRR was high enough that they gave the company $9 million. • Then, each year, the company will have to pay $1 million in coupon interest to the investors, and in 10 years it will also have to pay them the $10 million principal. • Over the 10 years it will be paying out RRRD to bond investors. • Suppose that there is also $20 million in stock sold and investors had RRRE of 15%. (c) Red Hill Capital Corp. 2009
RRR and the Company • Then, every year forever, technically, the company would have to pay stockholders 15%x$20 million = $3 million. • Thus, the company will have to pay out over $4 million/year as RRR’s to its investors who gave it money to invest in its business projects. • If it has $29 million in assets that it bought with their money, it will need to earn a return of about $4.1 million/$29 million = 14.1% = RRRX on those assets to make enough to pay annual payments to bond and stock holders. (c) Red Hill Capital Corp. 2009
Three Categories of CF’s for project • CF’s will fit into 3 basic slots for project evaluation. • In year 0, there will be investment in: PP&E plus WC. • In the middle, there will be the estimated CF from operation of the project; there might also be investment or divestment of WC and there might be more CF injections required for the project. • In the last year, there might also be WC reversal and AT sale of equipment. (c) Red Hill Capital Corp. 2009
Year 0: Invest in Project • Installed cost is all it takes to get and install the equipment. Then, that whole number is depreciated. • There may also be required investment in WC, e.g., buying inventory or making room for future A/R (c) Red Hill Capital Corp. 2009
WC Initial investment • You might need things like inventory and “room” to make sales on credit. • This is money you need upfront just as you do for equipment. • It can be subtle and then there might be inflows and outflow changes during intermediate years. (c) Red Hill Capital Corp. 2009
WC Initial investment • For example ass first year sales of $1 million. Your current WC is $50,000 and you want WC to be 10% of sales, then, before the first year you will need to increase WC by $50,000. • If future year sales increase, you will need to add WC investment in each year. If sales decline, you will get an CF inflow from WC. • Take a closer look at this factor in project investment and make sure that you understand it clearly. (c) Red Hill Capital Corp. 2009
Final year: TV sale PP&E; WC reverse • In the last year, you sell the equipment. • The Terminal value CF of sale of equipment is CFTV = Sale price – Tx[Sale – BV]. • You also have to reverse out any WC that was put in during the life of the project. • The WC might have been put in at the beginning and some more added or taken out over time. • In the final year, you must reverse out whatever is left because it all gets used up in the op CF’s, and the only thing you have left at the end is, possibly, cash. (c) Red Hill Capital Corp. 2009
WC recovery • Thus, we have IIO = – $100,000; CF = $100,000 (sales) – $100,000 (cost) = 0. • However, that would mean that we invested $100,000 and ended up with $0, which is not correct. • We actually got our $100,000 back. It’s just that the accounting for CF gave us $0 OCF, so we have to reverse out the inventory investment to make things right. • After all we have no inventory because Inventory (0) = $100,000 and inventory(1) = $0.
WC with changing sales • Working capital will be 9% of revenues for each year. The working capital investment has to be made at the start of each period. All working capital will be recovered. (c) Red Hill Capital Corp. 2009
RRRX and Projects • RRRX is basically the company’s cost of capital (COC). • That is the cost that it pays in percentage terms to the investors who give capital to the company to fund its operations. • Actually, COC will be slightly greater than RRRX because the company will have to pay costs to investment bankers, lawyers, regulatory agencies, accountants, brokers, etc. to help it issue the bonds and stock. (c) Red Hill Capital Corp. 2009
RRRX and Projects • Thus, the company will take in slightly less than $29 million, and since return is inversely related to price, COC> RRRX • The company, then, takes the capital that it raised from investors in the capital markets and invests to buy machinery and other things for its business. • It will use DFCF methods, like NPV, to value acquiring those business projects. • Since it has to pay COC to investors, it should use COC as the return it needs to earn on the projects it invests in. (c) Red Hill Capital Corp. 2009
Historical Returns (c) Red Hill Capital Corp. 2009
Historical Returns • Chinese proverb: to dwell on the past robs the present; to forget the past, robs the future. • There is a whole field of market analysis, called technical analysis, that tries to find patterns in the markets to predict the future of the markets. • Although that causes great debate among academics, the fact remains that we can certainly see some broad patterns and learn something from the past of financial markets. (c) Red Hill Capital Corp. 2009
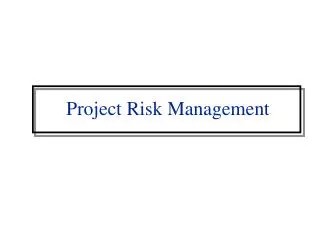
Historical Returns • We take a first look at returns as compiled in the book “Triumph of the Optimists: 101 years of Global Investment Returns,” by Dimson, March and Staunton. • In the graph in the next slide (log-scale) are shown what $1 invested at the beginning of the 101 year period in various asset portfolios would have been worth at the end. • Included in the graph are equities, bonds, cash as an investment in 30-day bank bills, plus inflation is also shown. (c) Red Hill Capital Corp. 2009
101 Years of Investment Prices (c) Red Hill Capital Corp. 2009
Graph Analysis (Text: Figure 10.4) • From the graph, you can see that the equity investment was, by far, the most fruitful. $1 became $83,364. • The bond portfolio resulted in $1 becoming only $166 by the end. • Cash investment in ST BAB’s became $85. • Moreover, inflation of prices over the period can be interpreted as $56 was needed by the end of the period to purchase the same goods and services that cost only $1 at the beginning. (c) Red Hill Capital Corp. 2009
Detailed Returns • The authors of the textbook have compiled quarter-to-quarter returns for classes of Australian assets (over 20 years). • The portfolios for which they have calculated returns are: • ASX All Ordinaries Index, which includes shares of the 500 largest listed public Australian companies (in terms of market capitalization). (c) Red Hill Capital Corp. 2009
Detailed Returns • A portfolio of Australian Government bonds with 10 years to maturity • Cash as investment in a portfolio of 30-day BAB’s, and • The CPI, the consumer price index, which is a broad measure of inflation in a typical basket of consumer goods and services. • In the next few slides, we show the quarter-to-quarter returns of the various portfolios. (c) Red Hill Capital Corp. 2009
Q-to-Q Returns on ASX All Ord. ASX All Ordinaries Index (c) Red Hill Capital Corp. 2009