Investments & Financial Assets
1.5k likes | 1.78k Vues
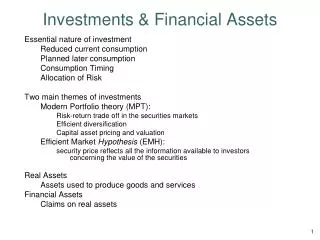
Investments & Financial Assets. Essential nature of investment Reduced current consumption Planned later consumption Consumption Timing Allocation of Risk Two main themes of investments Modern Portfolio theory (MPT): Risk-return trade off in the securities markets

Investments & Financial Assets
E N D
Presentation Transcript
Investments & Financial Assets Essential nature of investment Reduced current consumption Planned later consumption Consumption Timing Allocation of Risk Two main themes of investments Modern Portfolio theory (MPT): Risk-return trade off in the securities markets Efficient diversification Capital asset pricing and valuation Efficient Market Hypothesis (EMH): security price reflects all the information available to investorsconcerning the value of the securities Real Assets Assets used to produce goods and services Financial Assets Claims on real assets
Major Classes of Financial Assets or Securities Debt Money market instruments Bonds Equity Common stock Preferred stock Derivative securities
Agency Issues and Crisis in Corporate Governance Accounting Scandals Examples – Enron and WorldCom Analyst Scandals Example – Citigroup’s Salomon Smith Barney Initial Public Offerings Credit Swiss First Boston
The Agency Problem Agency relationship Principal hires an agent to represent their interest Stockholders (principals) hire managers (agents) to run the company Two conditions of agency problem: 1. Conflict of interest between principal and agent 2. Asymmetric information Management goals and agency costs
The Investment Process A Top-Down Analysis of Portfolio Construction the Capital Allocation decision Choice of safe but low-return money market securities, or risky but higher-return securities (e.g., stocks) the Asset Allocation decision the distribution of risky investments across broad asset classes like stocks, bonds, real estates, foreign assets, and so on. the Security Selection decision the choice of which particular securities to hold within each asset class security analysis involves the valuation of particular securities: must forecast dividends and earnings fundamental/ technical analysis Market efficiency
Active vs. Passive Management Active Management Finding undervalued securities Timing the market Passive Management No attempt to find undervalued securities No attempt to time Holding an efficient portfolio
Major Financial Markets and Assets or Securities Money market Treasury bills, Certificates of deposits, Commercial Paper, Bankers Acceptances, Eurodollars, Repurchase Agreements (RPs) and Reverse RPs, Brokers’ Calls, Federal Funds, etc. Treasury bills most marketable; highly liquid; discount bond maturities: 28, 91, 182 days minimum denomination: $1,000 Issued weekly
Costs of Trading Commission: fee paid to broker for making the transaction Spread: cost of trading with dealer Bid: price dealer will buy from you Ask: price dealer will sell to you Spread: ask - bid Combination: on some trades both are paid
T-bill T.B yields are quoted as the “bank discount yield” rBD = 10,000 - P x 360 10,000 n where P = the bond price; n = the maturity in days; rBD = the bank discount yield; $10,000 = par value. To determine the T-bill’s true market price: P = 10,000 x [ 1 - rBD x n/360 ] Ex. T-bill sold at $9,500 with a maturity of a half year (182 days): rBD= (500/10,000) x (360/182) = 0.0989 (9.89%) The “bond equivalent yield” of the T-bill = APR (annual percentage rate) rBEY = (10,000 - P)/P x (365/n) = (500/9,500) x (365/182) = 10.555% Effective annual yield: reay ( 1 + 500/9,500 )2 - 1 = 0.1080 (10.8%) note: rBD < rBEY < rEAY What is the asked price, equivalent yield, and effective yield for the T-Bill marked red in previous slide? RBEY = 365*rBD/(360-n*rBD)
Major Financial Markets and Assets or Securities Bond market Treasury Notes and Bonds Maturities Notes – maturities up to 10 years Bonds – maturities in excess of 10 years 2001 Treasury suspended sales Note: 11/1/2001: The Treasury department would no longer sell 30-year bonds, for years the benchmark for the entire $17.7 trillion U.S. bond market – long-term interest rate will decline. Now 10-year Treasury takes over the benchmark title. 2005 resume sales Par Value - $1,000 Quotes – percentage of par
Example12 If a treasury note has a bid price of $982.50, the quoted bid price in the Wall Street Journal would be __________. A) $98:08 B) $98:25 C) $98:50 D) $98:40 The price quotations of treasury bonds in the Wall Street Journal show an ask price of 104:16 and a bid price of 104:08. As a buyer of the bond you expect to pay __________. A) $1,041.60 B) $1,045.00 C) $1,040.80 D) $1,042.50
Example 34 Suppose you pay $9,800 for a Treasury bill maturing in two months. What is the annual percentage rate of return for this investment? A) 2% B) 12% C) 12.2% D) 16.4% Suppose you pay $9,700 for a Treasury bill maturing in six months. What is the effective annual rate of return for this investment? A) 3.1% B) 6% C) 6.18% D) 6.28%
Municipal Bonds Issued by state and local governments Interest income is exempt Types General obligation bonds Revenue bonds Industrial revenue bonds Maturities – range up to 30 years
Municipal Bond Yields Interest income on municipal bonds is not subject to federal and sometimes state and local tax r = rm / (1 - t), where rm = the rate on municipal bonds; t = the investor’s marginal tax bracket; r = the total before-tax rate of return on taxable bonds. Ex. rm = 10%; t = 28% : then r = 13.89%, if t = 36%: then r = 15.625% Ex. A municipal bond carries a coupon of 6% and is trading at par; to a taxpayer in a 36% tax bracket, What is the taxable equivalent yield of this bond ?
Corporate Bonds Issued by private firms Semi-annual interest payments Subject to larger default risk than government securities Options in corporate bonds Callable Convertible
Example31 The purchase price for a bond is listed as 104 and the annual coupon rate is 4.3%. What is the current yield (annual coupon payment / current price) on this bond? A) 0.00% B) 4.00% C) 4.13% D) 4.30% What is the tax exempt equivalent yield on a 9% bond yield given a marginal tax rate of 28%? A) 6.48% B) 7.25% C) 8.02% D) 9.00%
Equity Markets Common stock Residual claim Limited liability Preferred stock Fixed dividends - limited Priority over common Tax treatment Depository receipts
Uses of Stock Indexes Track average returns Comparing performance of managers Base of derivatives
Factors for Construction of Stock Indexes Representative? Broad or narrow? How is it weighted?
Examples of Indexes - Domestic Dow Jones Industrial Average (30 Stocks) Standard & Poor’s 500 Composite NASDAQ Composite NYSE Composite Wilshire 5000 CurrentlyDJIA: Alcoa, Allied Signal, American Express, American International Group Inc, Boeing, Caterpillar, Citigroup, Coca-Cola, DuPont, Exxon, General Electric, General Motors, Hewlett-Packard, Home Depot, IBM, Intel, Johnson & Johnson, McDonald, Merck, Microsoft, 3M, JP Morgan, Pfizer, Phillip Morris, Proctor& Gamble, SBC Communications, United Technologies, Verizon Communications, Wal-Mart Stores, Walt Disney.
Construction of Indexes How are stocks weighted? Price weighted (DJIA) (p40 example 2.2) Market-value weighted (S&P500, NASDAQ) (p46 example 2.4) S&P 500 Index = [Pit Qit / O.V. ] x 10 where O.V. = original valuation in 1941-1943 (i.e., relative to the average value during the period of 1941-1943, which was assigned an index value of 10) 81% of the mkt value of companies on the NYSE Equally weighted (Value Line Index)
Options Basic Positions Call (Buy) Put (Sell) Terms Exercise Price Expiration Date Assets Futures Basic Positions Long (Buy) Short (Sell) Terms Delivery Date Assets Derivatives Securities
Example33 The Chompers Index is a price weighted stock index based on the 3 largest fast food chains. The stock prices for the three stocks are $54, $23, and $44. What is the price weighted index value of the Chompers Index. A) 23.43 B) 35.36 C) 40.33 D) 49.58 A benchmark index has three stocks priced at $23, $43, and $56. The number of outstanding shares for each is 350,000 shares, 405,000 shares, and 553,000 shares, respectively. If the market value weighted index was 970 yesterday and the prices changed to $23, $41, and $58, what is the new index value? A) 960 B) 970 C) 975 D) 985
Primary vs. Secondary Security Sales Primary New issue Key factor: issuer receives the proceeds from the sale Secondary Existing owner sells to another party Issuing firm doesn’t receive proceeds and is not directly involved
How Firms Issue Securities Investment Banking Shelf Registration Private Placements Initial Public Offerings (IPOs)
Investment Banking Arrangements Underwritten vs. “Best Efforts” Underwritten: firm commitment on proceeds to the issuing firm Best Efforts: no firm commitment Negotiated vs. Competitive Bid Negotiated: issuing firm negotiates terms with investment banker Competitive bid: issuer structures the offering and secures bids
Figure 3.1 Relationship Among a Firm Issuing Securities, the Underwriters and the Public
Initial Public Offerings Process Road shows: 1. generate interest among potential investors and provide information about the offering. 2. provide price information to the issuing firm and its underwriters. Bookbuilding: process of polling potential investors Underpricing Post sale returns Cost to the issuing firm
Figure 3.4 Long-term Relative Performance of Initial Public Offerings
Type Buy Sell Market order Buy at best price available for immediate execution. Sell at best price available for immediate execution. Limit order Buy at best price available, but not more than the preset limit price. Forgo purchase if limit is not met. Sell at best price available, but not less than the preset limit price. Forgo sale if limit is not met. Stop orders convert to a market order to buy when the stock price crosses the stop price from below. convert to a market order to sell when the stock price crosses the stop price from above Stock Market Order Types
Limited Order and Stop order Ex. Stock A selling $25: a limit buy @ $23 [instruct the broker to buy when price falls below $23]; a limit sell @$27 [to sell when price goes above $27] Stop-loss (sell) orders [ex. Stop sell @$20]: to sell if price falls a stipulated level to sell to stop further losses from accumulating Stop-buy orders [ex. Stop buy at @$30]: to buy when price rises above a given limit accompany short sales, to limit potential losses from the short position (problem 20, 21)
Order Specification and Trading Mechanisms Order specification name of Company buy or sell size of order (odd lots = less than 100 shares; round lots = 100 shares) how long is order to be outstanding (when expires) types of order Dealer markets Electronic communication networks (ECNs) Specialists markets
U.S. Security Markets Nasdaq Small stock OTC Pink sheets Organized Exchanges New York Stock Exchange American Stock Exchange Regionals Electronic Communication Networks (ECNs) National Market System
OTC (Nasdaq) No central physical location No membership requirements for trading: brokers register with the SEC as dealers in OTC dealer market: quote bid & asked prices and execute, over 400 market makers note: bid (asked) price: at which a dealer is willing to purchase (sell) about 35,000 issues are traded NASD (National Association of Sec. Dealers) oversees trading of OTC securities in 1971, the NASDAQ system began The Nasdaq composite Index includes about 3,400 companies (about 5,000 companies in 2000) whose weight in the index is based on market capitalization Nasdaq operates two market segments: Nasdaq National Market and Nasdaq SmallCap Market (listing requirements differ)
New York Stock Exchange A facility (central physical location) Only members may trade The NYSE membership is limited to 1,366 members since 1953, who collectively own the NYSE. The NYSE represents approximately 80% of the value of all publicly owned companies in America. Memberships (or seats) are valuable assets ($1 mil:1/6/2005, $1.7 mil: 4/3/00, $2 mil in 2003) Member functions Commission brokers Floor brokers Specialists
Margin Trading Using only a portion of the proceeds for an investment Borrow remaining component Margin arrangements differ for stocks and futures Margin is the net worth of the investor’s account
Stock Margin Trading Maximum margin is currently 50%; you can borrow up to 50% of the stock value Set by the Fed Maintenance margin: minimum amount equity in trading can be before additional funds must be put into the account Margin call: notification from broker you must put up additional funds
Margin Trading - Initial Conditions X Corp $70 50% Initial Margin 40% Maintenance Margin 1000 Shares Purchased Initial Position Stock $70,000 Borrowed $35,000 Equity 35,000
Margin Trading - Maintenance Margin Stock price falls to $60 per share New Position Stock $60,000 Borrowed $35,000 Equity 25,000 Margin% = Equity/Asset =$25,000/$60,000 = 41.67%
Margin Trading - Margin Call How far can the stock price fall before amargin call? (1000P - $35,000)* / 1000P = 40% P = $58.33 * 1000P - Amt Borrowed = Equity
Short Sales Purpose: to profit from a decline in the price of a stock or security Mechanics Borrow stock through a dealer Sell it and deposit proceeds and margin in an account. allowed only after an ‘uptick’ (P > 0) Closing out the position: buy the stock and return to the party from which is was borrowed
Assets Liabilities & Account Equity Proceeds from sale $3,000 Short position $3,000 Initial margin deposit 1,500 Account equity 1,500 Total $4,500 Total $4,500 Short Sales Example: Short Sales You want to short 100 Sears shares at $30 per share. Your broker has a 50% initial margin and a 40% maintenance margin on short sales. Worth of stock borrowed = $30 × 100 = $3,000
Assets Liabilities & Account Equity Proceeds from sale $3,000 Short position $2,000 Initial margin deposit 1,500 Account equity 2,500 Total $4,500 Total $4,500 Short Sales Example: Short Sales …continued Scenario 1: The stock price falls to $20 per share. New margin = equity/short position = $2,500 / $2,000 = 125%
Assets Liabilities & Account Equity Proceeds from sale $3,000 Short position $4,000 Initial margin deposit 1,500 Account equity (A-L) 500 Total $4,500 Total $4,500 Short Sales Example: Short Sales …continued Scenario 2: The stock price rises to $40 per share. New margin = equity/short position=$500 / $4,000 = 12.5% < 40% Therefore, you are subject to a margin call.
Short Sale - Initial Conditions Z Corp 100 Shares 50% Initial Margin 30% Maintenance Margin $100 Initial Price Sale Proceeds $10,000 Margin & Equity 5,000 Stock Owed 10,000
Short Sale - Maintenance Margin Stock Price Rises to $110 Sale Proceeds $10,000 Initial Margin 5,000 Stock Owed 11,000 Net Equity 4,000 Margin % (4000/11000) 36%