Download
1 / 29
290 likes | 309 Vues
RHIC Polarimetery in Run9, sqrt (s)=200 GeV. A.Bazilevsky for RHIC Polarimetry group May 12, 2009. HJet. HJet. ToF vs Energy. Forward scattered proton. proton beam. proton target. recoil proton. Energy vs Channel #. YELLOW side. BLUE side.

E N D
RHIC Polarimetery in Run9, sqrt(s)=200 GeV A.Bazilevsky for RHIC Polarimetry group May 12, 2009
HJet ToF vs Energy Forward scattered proton proton beam proton target recoil proton Energy vs Channel # YELLOW side BLUE side Array of Si detectors measures TR&ToFof recoil proton. Channel # corresponds to recoil angle R. Correlations (TR & ToF ) and (TR & R ) the elastic process
Hjet Fill 10663
Hjet: StabilityTarget asymmetry • Should be constant vs fill (for fixed Ptarget) • Should be consistent between blue and yellow • 0.04170.0004 vs 0.04180.0004 • Should be consistent between Years (for fixed Ptarget) • Run5: 0.04090.0004 • Run6: 0.04130.0002 • Run8: 0.04220.0003 Multi-Year consistency within ~1%
Hjet: StabilityBackground Background (with two beam mode) is on the same level as with one beam mode ~Constant vs fill On the same level as in Run5&6 (removed collimators in Run8 larger background)
Hjet: results <P>=55% <P>=55% Fill-by-fill variations as well as variations within a fill should be estimated from pC polarimter
6 1 2 5 3 4 Ultra thin Carbon ribbon Target (5 mg/cm2) pC 18cm Two independent polarimeters in each ring (so 4 polarimeters!) 12 carbon targets in each polarimter (6 vertical and 6 horizontal) 6 detectors in each polarimeter 3 types of detectors: “BNL strip”: 12 strip in each detector “Hamamatsu strip”: 12 strip in each of 2 detector (blue2) “Hamamatsu pad”: 2 pads in each of 2 detector (yellow2) Si strip detectors (TOF, EC)
pC Rate history s=200 GeV • Severe rate problems observed during Run9 sqrt(s)=500 GeV • Higher rate lower measured polariation • Target changed in Yellow1 to thicker one (from Fill 10686) Rate problems!
pC measurements Online Polarization , not normalized (!) vs fill Fills 10616 (Apr 18) – 10713 (May 8) “Online” polarizations: 0.50-0.60 Pol-1 measure slightly lower than Pol-2: by ~6% Blue1/Blue2: consistent within stat. uncertainties Yell1/Yell2: shows variations above stat. uncertainties May show a gradual decrease (5-7%) from fill 10616 to 10713 may come from detector degradation
pC-BluevsHJet Hjet/pC is stable over fills within (large) stat. errors (of HJet) HJet: <P>=55% (fills 10616-10713) HJet/Blue1 1.05 HJet/Blue2 0.99
pC-Yellow vs HJet Hjet/pC is stable over fills within (large) stat. errors (of HJet) HJet: <P>=55% (fills 10616-10713) HJet/Yell1 1.07 HJet/Yell2 1.00
More precise Hjet-pC comparison Hjet: fills combined in 8 periods Clear correlation between Hjet and pC Consistency vs fill within 5% pC-blue HJet pC-yellow HJet
pC: Pol. Profile Polarimeters 2 Polarimeters 1 Horizontal profile Vertical profile Vertical profile Horizontal profile Usual… R0.15 in previous years (100 GeV beams) R0.1 Experiments see 5% more polarization than Hjet
pC: Consistency within a Fill Clear polarization decay Consistent between Pol1 and Pol2 10685-Blue 10704-Blue
pC: Consistency within a Fill Prob(2, NDF) – from the fit to a constant in a fill Should be uniform if variations within a fill are only due to stat. errors Should show higher density near 0 if there are “sizable” syst. effects No systematic effects (comparable to stat. errors) are seen within a fill
Pol. Decay In a fill: fit to exp(-t/Tdecay) <Tdecay> = 80-180 hours <Tdecay> = 250-800 hours May need rate correction! • Run6: • <Tdecay> ~150 hours • Run8: • <Tdecay> ~400 hours • <Tdecay> ~100 hours
pC: pol. at injection <P>~55% (similar to flattop) Pol1 measures smaller values than Pol2 by ~5% (similar to flattop, or slightly smaller due to smaller rate effect at injection)
pC: injection vs flattop On the average no difference within 4%: Assuming that we don’t lose polarization on the ramp AN(inj)/ AN(ftp) is known within 4% Correction due to rate effect and polarization decay at store may be needed Assuming that AN(inj)/ AN(ftp) is correct Polarization loss on the ramp <4%
Summary • HJet: • Running in stable conditions: <P>~55% • pC: • Blue1 vs Blue2 consistent behavior • Yell1 vs Yell2 show systematic effects ~5-7% (may be due to larger rate effects in Yell1) • pC vs Hjet: consistent within stat. errors • Hjet/Pol1 ~ 1.06; Hjet/Pol2 ~ 1 • Might be ~5% drop in the pC measurements from the beginning to the end of the run due to detector degradation (“dead layer” increase) • Measurements are statistically consistent within a fill • Polarization decay Tdecay ~ 100-200 hours • Polarization profile no sharper than in previous years • Experiments see ~5% more polarization than Hjet • Measurements at injection and flattop are consistent within ~4% • Correction for polarization decay and rate effects at flattop may lead to even better consistentcy… • “Fast offline” results can be used only with special care/caution • Needs monitoring: parameter retuning sometimes fails
Rate history s=500 GeV
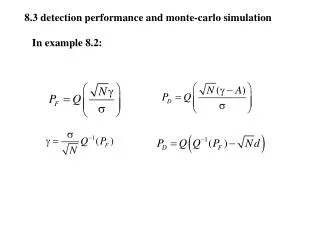
P 2. Obtain R directly from the P(I) fit: I R=0.290.07 pC: Polarization Profile Scan C target over the beam cross: pC 1. Directly measure I and P : P Polarization I Intensity Target Position Precise target positioning is NOT necessary