Download
1 / 24
240 likes | 357 Vues
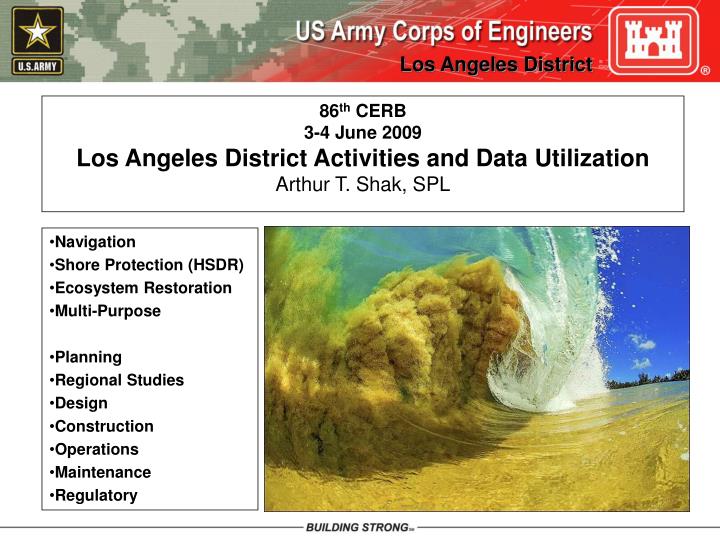
86 th CERB 3-4 June 2009 Los Angeles District Activities and Data Utilization Arthur T. Shak, SPL. Navigation Shore Protection (HSDR) Ecosystem Restoration Multi-Purpose Planning Regional Studies Design Construction Operations Maintenance Regulatory. SPL COASTAL PROJECTS.

E N D
86th CERB3-4 June 2009Los Angeles District Activities and Data UtilizationArthur T. Shak, SPL Navigation Shore Protection (HSDR) Ecosystem Restoration Multi-Purpose Planning Regional Studies Design Construction Operations Maintenance Regulatory
SPL COASTAL PROJECTS • Coastal Studies (14) • Regional Studies (3) • State-wide Sediment Master Planning • Harbors (14, 4 deep-draft) • Beach Nourishment Projects (3)
DATA UTILIZATION • Tides and Water Levels • Waves • Topography and Hydrography
1982-83 1997-98 INTERANNUAL VARIATIONS IN MONTHLY MEAN SEA LEVELS
FUTURE SEA LEVEL RISE • La Jolla Tide Gage • Relative to 1983-2001 MLLW tidal epoch. • 1997-98 ENSO already ½ foot above normal sea levels. • Typical economic evaluation period of 50-years.
GROW DATA from Gpt 38190 1/1/1970 to 12/31/2005 transformed to nearshore locations to create 35-year hindcast.
SPATIAL VARIATION IN EXTREME WAVE HEIGHTS LOS ANGELES COUNTY
LIFE CYCLE ANALYSIS • MONTE CARLO SIMULATION OVER PROJECT PERIOD. • ENSO CORRELATES WITH ELEVATED WATER LEVELS AND ABOVE AVERAGE NUMBER OF EVENTS. • PHASING WITH SPRING TIDE LARGE DETERMINANT. • SEASONAL AND SHORT TERM SHORELINE RESPONSE HIGHLY VARIABLE. • USE OF SYNTHETIC WAVE CLIMATES APPLIED. • RUNUP AND OVER-TOPPING OVER NATURAL AND PROTECTED PROFILES IS CAUSE OF COASTAL FLOODING (at most SPL sites).
Topo and Hydro Data • Encinitas and Solana Beach Feasibility • LIDAR and CHARTS to map bluff and infrastructure offsets. • SANDAG multibeam and sea floor mapping used in environmental impact analysis. • Coast of CA, SANDAG and City Sponsored beach profiling used for analysis of sand distribution in cross-shore dimension.
Topo and Hydro Data Mission Bay Middle Jetty Repair Included in 2009 ARRA. Missing seaward 200 feet, as of Apr 2009 LIDAR. 2004 CHARTS survey showed 150 feet missing.
2006 OCT 21 Southern California Beach Processes Study (SCBPS) LIDARof Mission Bay Middle Jetty 2008 APR 12 2009 MAR 08
Regional High resolution LIDAR readily available. Difficult to predict, budget and schedule data need. In the “can” products facilitates rapid response with less guessing. 2009 ARRA Repairs toMission Bay Middle Jetty
1330 – Leave Hotel (Lunch provided on Bus) • 1400 – 1430 Tour and Presentation by Scripps of San Elijo Lagoon Mouth • 1445 – 1530 Tour and Presentation by Solana Beach, Encinitas, Scripps and Corps of Solana Beach • 1600 – 1645 Tour and Presentation by Scripps of Torrey Pines State Reserve • 1715 - Return to Hotel