Analysis of Suspicious Activity Reports in Guam (1996-2006)
This report examines the filing trend of Suspicious Activity Reports (SARs) in Guam from April 1, 1996, to December 31, 2006, totaling 1,332 reports. It highlights the characterizations of suspicious activities, represented in a pie chart of the top nine categories, alongside additional characterizations. Importantly, multiple characterizations may apply to a single SAR, leading to a greater count of characterizations than SARs. Furthermore, the report includes geographic patterns for 2006 but notes limitations in mapping due to the low volume of SARs during this period.

Analysis of Suspicious Activity Reports in Guam (1996-2006)
E N D
Presentation Transcript
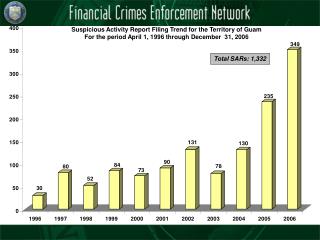
Suspicious Activity Report Filing Trend for the Territory of GuamFor the period April 1, 1996 through December 31, 2006 Total SARs: 1,332
Characterizations of Suspicious Activity for the Territory of Guam For the period April 1, 1996 through December 31, 2006 Note: The pie chart represents the top nine characterizations plus additional characterizations in total. An individual SAR may cite more than one characterization. Hence, the number of characterizations detailed here significantly exceeds the total number of SARs.
Suspicious Activity Report Geographic Pattern for the Territory of Guam For the period January 1, 2006 through December 31, 2006 Due to the low volume of Suspicious Activity Reports for the Territory of Guam, mapping is unavailable.