Protein Interactions Analysis in Infected Cells Using siRNA and WB
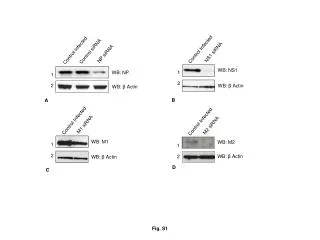
This study investigates protein interactions in infected cells using siRNA targeting specific proteins. Western blot analysis was done to assess the impact of siRNA on NP, NS1, and M1 protein levels.

Protein Interactions Analysis in Infected Cells Using siRNA and WB
E N D
Presentation Transcript
WB: β Actin Control Infected Control Infected Control Infected 1 1 NS1 siRNA M1 siRNA M2 siRNA 2 2 WB: NP WB: M2 WB: NS1 WB: M1 B A WB: β Actin WB: β Actin WB: β Actin 1 1 2 2 D C Control siRNA Control Infected NP siRNA Fig. S1
pEGFP-NS1 pEGFP-NP pEGFP pEGFP-M1 Control pEGFP-M2 Fig. S2
WB anti CLU IP anti NP IP anti M1 IP anti M2 IP anti NS1 WB NP WB NS1 PR8 IAV WB M2 WB M1 PR8 IAV CLU WB CLU 1 2 10% Input WB GAPDH 3 4 5 6 B A Fig. S3
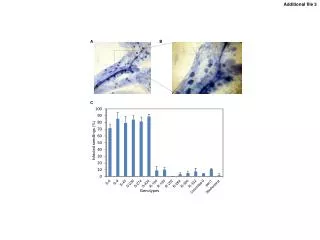
Nascent Clusterin SP β chain α chain GST GST GST CLU Full length β chain α chain CLU β Chain β chain CLU α Chain α chain 6xHis IAV NP A Fig. S4
1 1 GST Pull down samples 1% input 1 2 3 4 1 2 3 4 GST pull down WB: His WB: His GST Pull down samples 1% input 2 2 1 2 3 4 1 2 3 4 C B GST pull down WB: GST WB: GST • CLU Full- GST + IAV NP-His • CLU β-GST + IAV NP-His • CLU α-GST + IAV NP-His • GST + IAV NP –His Fig. S4
1 2 3 Mock 0h 4h 8h 12h 4 WB: GAPDH WB: NP WB: CLU WB: Calnexin Fig. S5
NP Cyt C NP Cyt C Hoechst Merge Hoechst Merge pcDNA3.1 myc-NP pcDNA3.1 myc. A B Fig. S6
pCMV XL4- CLU pCMV Control 1 WB CLU Control Control siRNA 2 WB β Actin CLU siRNA A 1 WB CLU WB β Actin 2 B Fig. S7