Download
1 / 7

E N D
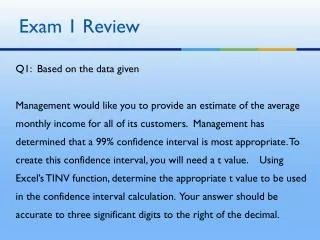
Exam 1 Review Q1: Based on the data given Management would like you to provide an estimate of the average monthly income for all of its customers. Management has determined that a 99% confidence interval is most appropriate. To create this confidence interval, you will need a t value. Using Excel’s TINV function, determine the appropriate t value to be used in the confidence interval calculation. Your answer should be accurate to three significant digits to the right of the decimal.
Exam 1 Review Q2: Based on the data given Management would like you to provide an estimate of the average monthly income for all of its customers. A major concern of management is the size of any “margin of error” built into your estimate. Assuming that you are providing a 99% confidence interval, use Excel to determine the “margin of error”. What value do you provide to management? Your answer should be accurate to two significant digits to the right of the decimal. Do not include scale indicators ($, %, etc.) in your answer.
Exam 1 Review Q3: Based on the data given You have provided management with the confidence interval for the average monthly income for all of its customers. Unfortunately, management is not quite sure what to make of the interval and has thrown different interpretations at you. Identify the interpretation that most accurately describes the situation. a) Since the customers in the sample may have had different jobs (and incomes) at different times of their life, the confidence interval addresses this variability in income and gives us a more encompassing picture of the average monthly income of those customers. b) Our customers’ monthly incomes are likely growing over time as their careers progress. Given that the data you analyzed was at a specific point in time, the confidence interval allows us to more accurately analyze the future monthly income of customers. c) We only have a sample of customer information but want to infer about all of our customers including those not in the sample. This requires a margin of error to compensate in case our calculations are inaccurate.
Exam 1 Review Q3: Based on the data given d) We have a sample of monthly income and an average of that sample. The interval you are providing gives us a margin of error to address the lack of information on all of the customers not in the sample. e) This confidence interval you are providing compensates for data collection problems and data inaccuracy. However, if we need to be more accurate, then the best number we could use would be the average for the sample.
Exam 1 Review Q4: Based on the data given Suppose you intend to calculate a 95% confidence interval for the proportion of all Wal-Mart customers that own their residence. What z-score would you use to calculate that confidence interval? Your answer should be accurate to three significant digits to the right of the decimal.
Exam 1 Review Q5: Based on the data given From the raw data available in the file, determine the proportion in this sample that indicated they own their residence. Be sure to comb the data for mistyped entries. Your answer should be accurate to four significant digits to the right of the decimal and in decimal format (i.e. 45.1% is 0.451). Do not include scale indicators ($, %, etc.) in your answer.
Exam 1 Review Q6 The average family size in the nation (in number of children) has been reported to be 2.4 children. Management is interested in whether Wal-mart customers fit this average. Based on the information given, identify the most appropriate alternative hypothesis to test this hypothesis. a) The average number of children of Wal-mart customer’s family in the sample is greater that the reported national average of 2.4. b) The average number of children in a Wal-mart customer’s family is different than the reported national average of 2.4. c)The average number of children in a Wal-mart customer’s family is the same as the reported national average of 2.4. d)The average number of children in a Wal-mart customer’s family in the sample is different than the reported national average of 2.4. e)The average number of children of Wal-mart customer’s family in the sample is the same as the reported national average of 2.4.