GOES-R Mission Threads and Operational Viability – Satellite Proving Ground Meeting Summary
140 likes | 269 Vues
The June 2014 Satellite Proving Ground Meeting focused on GOES-R Mission Threads, identifying key operational goals to enhance the performance of AWIPS-II development. A review of 267 documents led to the identification of 498 thread endpoints and 196 potential thread candidates. The meeting emphasized the creation of "reference" scenarios to validate the operational viability of GOES-R systems, stakeholder involvement, and training documentation in the NWS Virtual Lab. By analyzing current operational configurations, stakeholders aimed to derive critical validation objectives for improved system usability.

GOES-R Mission Threads and Operational Viability – Satellite Proving Ground Meeting Summary
E N D
Presentation Transcript
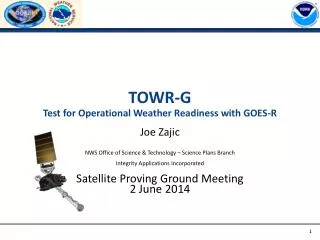
TOWR-G Mission Threads Eric Guillot NWS Office of Science & Technology – Science Plans Branch Integrity Applications Incorporated Satellite Proving Ground Meeting 2 June 2014
Thread Batch One • Initial Threads identified from the NWS Directives (categorized via NOSIA Mission Service Areas) • 267 source documents reviewed, 498 Thread Endpoints, 196 GOES-R Thread Candidates (Candidate/Total Endpoints) • The following four threads comprise Batch One:
Mission Thread Partners Current contacts for mission thread development:
Mission Thread Goals We acknowledge that Regions, WFOs, and even individual forecasters have a great deal of flexibility in how they configure and use their systems and data to carry out their mission. We are creating “reference” scenarios that will be used to evaluate the mission viability of the GOES-R infrastructure Mission Thread Goals: - Establish representative scenarios to validate GOES-R operational viability - Engage operational stakeholders on usage of GOES-R - Potential value to training effort - Documentation in NWS Virtual Lab - Support performance & content requirements for GOES-R AWIPS-II development - How many and which image loops are needed? - How many and which products need to be open at one time? - How many and which tools (D2D, GFE) need to be open per CAVE session? - Derive validation objectives to test the GOES-R AWIPS-II system usability
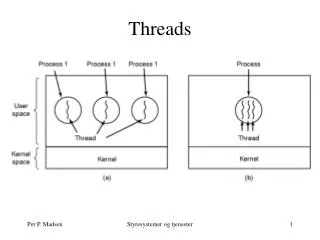
AWIPS-II Setup Text Workstation Graphic Workstations CAVE Session 3 CAVE Session 2 CAVE Session 1
Sample Threads Sample Mission Thread: Severe Thunderstorm Warning Developed with NWS Eastern Region Frank Alsheimer, Dave Radell
2 Regional View - 0.64 um channel (raster) - 7.34 um channel (raster) - 11.2 um channel (raster) - RAP 850mb winds (wind barb) - HRRR 850mb winds (wind barb) - WRF 850mb winds (wind barb) - RAP 700mb winds (wind barb) - HRRR 700mb winds (wind barb) - WRF 700mb winds (wind barb) Regional View - 0.64 um channel (raster) - 6.19 um channel (raster) - 6.95 um channel (raster) - 11.2 um channel (raster) - RAP 500mb vorticity (contour) - HRRR 500mb vorticity (contour) - WRF 500mb vorticity (contour) 1 3 Identify upper-level shortwaves & vorticity maxes and how observations differ from models Flow comparison between models and obs, elevated mixed layer, low-level destabilization of atmosphere (veering wind) Regional View - 6.19 um channel (raster) - 6.95 um channel (raster) - 7.34 um channel (raster) - RAP 700mb relative humidity (contour) - HRRR 700mb relative humidity (contour) - WRF 700mb relative humidity (contour) Regional View - 9.61 um channel (raster) - RGB Air Mass (raster) - RAP Tropopause Pressure (contour) - HRRR Tropopause Pressure (contour) - WRF Tropopause Pressure (contour) 4 Identify potential vorticity anomalies and stratospheric intrusions (corresponds to instability) and how observations differ from models Identify water vapor content of atmosphere and how observations differ from models 5
3 Regional View - Radar composite reflectivity (raster) - GOES-R Lightning Detection (crosshairs) - 0.64 um channel (mesoscale) (raster) - Ground-based lightning network (if available, crosshairs) - GOES-R Cloud Top Height (interrogation) - GOES-R Cloud Top Temperature (interrogation) - Warning polygons (raster) 1 2 Use composite reflectivity to identify sudden changes in max reflectivity. Also identify lightning strikes increases with lightning detection and ground-based lightning network. Ability to click a point to get cloud top height/temp information (identify cloud top quickly to diagnose storm strength). 4 5
Sample Threads Sample Mission Thread: Red Flag Warning Developed with NWS Western Region Mel Norquist, Mike Stavish, Marc Spidle
2 Regional View - 0.64 um channel (raster) - 11.2 um channel (raster) - GOES-R Cloud Top Temperature (interrogation) Regional View - 0.64 um channel (raster) - 11.2 um channel (raster) - GOES-R Cloud Top Height (interrogation) 1 3 Identify rate of cloud top temperature change in developing storm (indicative of strength of storm) Identify rate of cloud top height change in developing storm (indicative of strength of storm) Regional View - 0.64 um channel (raster) - 11.2 um channel (raster) - GOES-R Fire/Hot Spots (point display) - GOES-R Aerosol Detection (raster) Regional View - 0.64 um channel (raster) - 11.2 um channel (raster) - GOES-R Lightning Detection (point display) 4 Identify potential fires/smolders started by lightning Identify number/rate of lightning flashes (sudden increase is indicative of strengthening storm) 5
4 1 Regional View - GOES-R RGB Cloud Over Snow (raster) - GOES-R 0.64 um channel (raster) - GOES-R Land Surface Temp (raster) - SMAP Soil Moisture (raster) 2 Snow covered areas/high soil moisture areas may be excluded from Red Flag Warning area. Conversely, dry areas with no snow and high land surface temp may warrant a red flag area. 3 5
We invite you to get involved with current/future mission threads Side sessions with Eric Guillot and Joe Zajic in Room 121 all week TOWR-G Project, NWS Virtual Lab, RaFTR GOES-R Simulator
User Stories 2 hour – 45 min timeframe (prior to anticipated event) I want to be able to display the 0.64um imagery, the 6.19 um imagery, the 6.95 um imagery, and the 11.2 um imagery as raster images in one D2D pane. I am looking for shortwave troughs and vorticity maxima in the two water vapor channels. The location of these phenomenon will focus my surveillance for development of severe thunderstorms. I want to look at this imagery once or twice an hour. I need to be able to toggle easily back and forth between these water vapor images. The color table needs to be calibrated such that these phenomenon can be identified with no color manipulation required. The times of the data need to be in sync with one another. I need to see a loop of data two to three hours long displayed in about 10 seconds. The 0.64 um and 11.2 um data also needs to be displayed for situational awareness. I also need to display 500mb vorticitycontours from high resolution short-term weather models (RAP, HRRR, WRF, etc) in this same D2D pane. I need to be able to compare the location/movement of vorticity maximum between both the models and between the water vapor imagery. This will allow me to decide which model is best representing the current atmospheric state and better inform my decision of which model solution to believe. I need this model data to be a loop starting two to three hours in the past and takes me out three to four hours into the future that takes about 20 second to display. Each of these contours needs to be displayed in a different color. The model data output needs to be temporally in sync with one another and with the water vapor imagery as close as possible.