Download
1 / 52
520 likes | 747 Vues
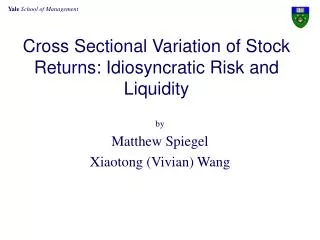
Cross Sectional Variation of Stock Returns: Idiosyncratic Risk and Liquidity. by Matthew Spiegel Xiaotong (Vivian) Wang. Cross Sectional Returns via Market Microstructure. Liquidity varies across stocks. More liquidity is better. Duh!

E N D
Cross Sectional Variation of Stock Returns: Idiosyncratic Risk and Liquidity by Matthew Spiegel Xiaotong (Vivian) Wang
Cross Sectional Returns via Market Microstructure • Liquidity varies across stocks. • More liquidity is better. Duh! • People should be willing to accept lower returns in exchange for higher liquidity levels.
Liquidity and Returns: Theory • No: Constantinides (1986), Heaton and Lucas (1996), Duffie and Sun (1990), Grossman and Laroque (1990), Vayanos (1998), Vayanos and Vila (1999) • Yes: Huang (2001), Homstrom and Tirole (2001), Demsetz (1968), Amihud and Mendelson (1986), Glosten and Milgrom (1987), Easley and O’Hara (2001), Easley, Hvidkjaer, and O’Hara (2001), Acharya and Pedersen (2005) Returns Liquidity
Liquidity and Returns: Empirical • As a cross-sectional characteristic: • Yes: Amihud and Mendelson (1988), Brennan and Subrahamanyam (1996), Brennan, Chordia, and Subrahamanyam (1998), Chalmers and Kadlec (1998), Hasbrouck (2005) • As a time-varying risk factor • Yes: Chordia et al. (2000), Huberman and Halka (2001), Pastor and Stambaugh (2003), Amihud (2002), Sadka (2004) • No: Hasbrouck and Seppi (2001)
Asset Pricing Research • If the CAPM assumptions do not hold exactly, idiosyncratic risk may be priced. Ex. Merton (1987). • Yes, it is positively correlated with stock return • Linter (1965), Lehmann (1990), Xu and Malkiel (2002), Fu (2005), Goyal and Santa-Clara (2003), Ghysels, Santa-Clara, and Valkanov (2004), Jiang and Lee (2005). • Yes: it is negatively correlated with stock return • Guo and Savickas (2004), Ang et al. (2005), Adrian and Rosenberg (2005). • No: • Miller and Scholes (1972), Fama and Macbeth (1973), Bali et al. (2004), Baker and Wurgler (2005). Returns Volatility
Cross Sectional Returns & CAPM • An aside that has nothing to do with my paper. • Myth: The idea that only “market risk” matters because in a diversified portfolio idiosyncratic risk is eliminated. • Truth: CAPM holds trivially with one stock, but also holds for two or more stocks. • Diversification (impossible with just two stocks) plays no role.
Conversation Between Asset Pricing and Market Microstructure? Returns Volatility Returns Liquidity Liquidity Volatility
Innovation Liquidity Volatility Returns
Question: Which Picture is Right? Liquidity Volatility Returns Liquidity Returns Volatility Liquidity Returns Volatility
Idiosyncratic Risk ?↔? Liquidity • Theory implies idiosyncratic risk and liquidity should be negatively correlated • Asset Pricing: Merton (1998) • Inventory Control: Ho and Stoll (1980) Spiegel and Subrahmanyam (1995) • Question: Are past empirical results relating returns to liquidity and idiosyncratic risk due to one, the other, or in some measure to both?
Linking Liquidity & Idiosyncratic Risk • Market maker stands ready to buy or sell on demand. • Likes capital gains. • Has a “target” inventory, dislikes ending the day away from the target due to overnight risk. • Can hedge out market risk. • High idiosyncratic risk stocks → lower liquidity as they leave the market maker with more risk for missing the end of day target.
Questions? • Idiosyncratic risk → Cross sectional return variation. • Liquidity → Cross sectional return variation. • Idiosyncratic risk → Liquidity • To what degree is the cross sectional variation in returns due to idiosyncratic risk or liquidity? • Do some measures explain more than others?
Answers: Acting Alone • EGARCH idiosyncratic risk strongly positively correlated with out of sample returns. OLS idiosyncratic risk uncorrelated with out of sample returns. • Cost and reflective liquidity measures correlated with returns. • Cost based: bid-ask spread • Reflective: volume
Answers: Acting Together • Controlling for idiosyncratic risk cost based liquidity measures play a minor role in cross sectional returns • Controlling for idiosyncratic risk volume plays a strong role in cross sectional returns. • Controlling for liquidity EGARCH measured idiosyncratic risk plays a major role.
Data • Monthly from CRSP. • Nice because fewer microstructure issues than daily data. • Find idiosyncratic risk is positively related to returns. Opposite of Ang et al. finding using daily data. • Do not explore why the monthly and daily data produce different answers. • Good question though for my next paper!
Daily vs. Monthly Data(Some clues though for the curious.) Choose the measure working against our result
Daily V.S. Monthly Data Bid-Ask bounce may contaminate the daily measure of Idio
Effect of Bid-Ask Bounce Ask Return has to go down Bid Higher Idio. Risk Higher Spread Return is more likely to go down Ask Bid
Measures • Need liquidity and idiosyncratic risk measures. • No kidding! • For liquidity use estimates provided on Joel Hasbrouck’s web page. • For idiosyncratic risk use EGARCH model.
Estimating Liquidity (Hasbrouck 2005) Hasbrouck’s Gibbs Sampler estimate of Roll’s (1984) effective Cost (bid ask spread): Pastor and Stambaugh’s Reversal Gamma
Forecasting Idiosyncratic RiskOLS vs. EGARCH OLS estimates of Idiosyncratic Risk (Idio) EGARCH estimation of Idiosyncratic Risk (Eidio)
OLS – EGARCH Contest • Use 60 months of data (1 to 60) to estimate each model. • Each model forecasts month 61 idiosyncratic risk. • OLS = Idio, EGARCH = Eidio. • Use OLS model to produce an estimate of month 61 idiosyncratic risk with data from month 2 to 61. Closest forecast in average absolute value across stocks wins! • Note: “Horse Race” strongly rigged to favor OLS.
EGARCH OLS Eidio Wins in 483 out of 505 Months
Relationship Between Idiosyncratic Risk, Size and Liquidity • Strong relationships across these three factors known to influence stock returns.
Illiquidity and Idiosyncratic Risk Edio significant w/ or w/o Size Edio explains as much as Size.
In Sample Test • Goal: Find high-low returns for one factor holding the other constant. • Each month stocks are simultaneous sorted into 10 portfolios based on each factor. • For a given decile on factor A calculate the return for a portfolio long in the highest factor B decile and short the lowest factor B decile.
Idiosyncratic Risk vs. Liquidity (Bid-Ask) • Both appear to be important. • Liquidity does a somewhat better job of sorting portfolios than does idiosyncratic risk. • But note the illiquid stocks have lower returns than the liquid stocks. • Evidence (more later) that when prices rise in a stock so does trading in the stock. That is liquidity is a result of returns not a cause.
In Sample Test For Eidio: Gibbs decile, For Gibbs: Eidio decile
Now for the Real Tests • In sample: Who really cares? • Out of sample: Potential to make actual money! • Everybody cares!
Portfolio Construction • Based on previous month’s Eidio form 10 portfolios • Hold this portfolio for 1 month. • Repeat
Two Way Sorts • Controls for one factor to see if the other factor continues to explain cross sectional stock returns. • Portfolios hold only stocks in the control decile and then sort on the factor of interest. • Three primary findings • Controlling for Eidio the bid-ask spread has little explanatory power. • Controlling for any other factor Eidio, and $ Volume continue to have significant explanatory power.
Bid-Ask Spread Out of Sample Annual Alphas[t-stat][Rank Corr. Sig. ++,- -=1%; +,-=5%] Most of the return is from small cap and high Eidio firms.
$ Volume Out of Sample Annual Alphas[t-stat][Rank Corr. Sig. ++,- -=1%; +,-=5%]
Eidio Out of Sample Monthly Alphas[t-stat][Rank Corr. Sig. ++,- -=1%; +,-=5%]
Regression Analysis • Regression risk adjusted return (alpha) on different characteristics • Controls For: • Size, • Liquidity (various measures), • Idiosyncratic Risk, • Lagged returns (momentum), and • Dollar volume • In the table note that liquidity is not significant when Eidio is included in the regression.
Missing Factor? • Are the high idiosyncratic risk portfolio returns due to a missing risk factor? • If so then high Eidio portfolios should have higher volatilities. • Missing risk factors should be correlated across the stocks and thus not diversify away.
Eidio Portfolio Risk and Return(All Firms – No Liquidity Measure Restriction)
Connor-Korajczyk Factors+++,--- = rank corr. sig. 1%, ++, -- = rank corr. sig. 5%, +, - = rank corr. sig. 10%
Connor-Korajczyk Factors+++,--- = rank corr. sig. 1%, ++, -- = rank corr. sig. 5%, +, - = rank corr. sig. 10%
Period Specific Results • Are the results due to a particular time period? • Results by decade. • Results by economic environment • Expansions vs. recessions. • High vs. low volatility periods.