Download
1 / 28
300 likes | 463 Vues
Risk and Rates of Return. Stand-alone risk Portfolio risk Risk & return: CAPM / SML. What are Investment Returns. Investment returns measure the financial results of an investment. Returns may be historical or prospective (anticipated). Returns can be expressed in: Taka

E N D
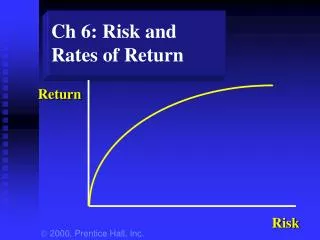
Risk and Rates of Return Stand-alone risk Portfolio risk Risk & return: CAPM / SML
What are Investment Returns • Investment returns measure the financial results of an investment. • Returns may be historical or prospective (anticipated). • Returns can be expressed in: Taka Percentage Terms
Investment returns The rate of return on an investment can be calculated as follows: (Amount received – Amount invested) Return =________________________ Amount invested For example, if $1,000 is invested and $1,100 is returned after one year, the rate of return for this investment is: ($1,100 - $1,000) / $1,000 = 10%.
Return Income received on an investment plus any change in market price, usually expressed as a percent of the beginning market price of the investment. Dt+ (Pt - Pt-1) R = Pt-1
Return Example The stock price for Stock A was $10 per share 1 year ago. The stock is currently trading at $9.50 per share, and shareholders just received a $1 dividend. What return was earned over the past year?
Return Example The stock price for Stock A was $10 per share 1 year ago. The stock is currently trading at $9.50 per share, and shareholders just received a $1 dividend. What return was earned over the past year? $1.00 + ($9.50 - $10.00) = 5% R = $10.00
What is investment risk? • Two types of investment risk • Stand-alone risk • Portfolio risk • Investment returns are not known with certainty. • Investment risk is related to the probability of earning a low or negative actual return. • The greater the chance of lower than expected or negative returns, the riskier the investment.
Return: Calculating the expected return for each alternative
Summary of expected returns for all alternatives Exp return B 17.4% E 15.0% D 13.8% A 8.0% C 1.7% B has the highest expected return, and appears to be the best investment alternative, but is it really? Have we failed to account for risk?
How to Determine the Expected Return and Standard Deviation KiPi (Ki)(Pi) -.15 .10 -.015 -.03 .20 -.006 .09 .40 .036 .21 .20 .042 .33 .10 .033 Sum1.00.090 • The expected return, R, for Stock is .09 or 9%
Risk: Calculating the standard deviation for each alternative
How to Determine the Expected Return and Standard Deviation KiPi (Ki)(Pi) (Ki -K)2(Pi) -.15 .10 -.015 .00576 -.03 .20 -.006 .00288 .09 .40 .036 .00000 .21 .20 .042 .00288 .33 .10 .033 .00576 Sum1.00.090 .01728
Determining Standard Deviation (Risk Measure) s = S ( Ki - K )2( Pi ) • = .01728 s = .1315 or 13.15%
Comments on standard deviation as a measure of risk • Standard deviation (σi) measures total, or stand-alone, risk. • The larger σi is, the lower the probability that actual returns will be closer to expected returns. • Difficult to compare standard deviations, because return has not been accounted for.
Determining Expected Return (Continuous Dist.) K = S ( Ki ) / ( n ) K is the expected return for the asset, Ki is the return for the ith observation, n is the total number of observations.
Determining Standard Deviation (Risk Measure) s = S ( Ki - K )2 ( n )
9.6%, -15.4%, 26.7%, -0.2%, 20.9%, 28.3%, -5.9%, 3.3%, 12.2%, 10.5% • Calculate the Expected Return and Standard Deviation
Coefficient of Variation (CV) A standardized measure of dispersion about the expected value, that shows the risk per unit of return.
Risk rankings, by coefficient of variation CV A 0.000 B 1.149 C 7.882 D 1.362 E 1.020 C has the highest degree of risk per unit of return. B, despite having the highest standard deviation of returns, has a relatively average CV.
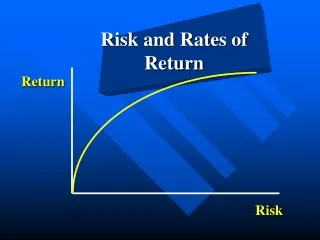
Investor attitude towards risk • Risk aversion – assumes investors dislike risk and require higher rates of return to encourage them to hold riskier securities. • Risk premium – the difference between the return on a risky asset and less risky asset, which serves as compensation for investors to hold riskier securities.
Portfolio construction:Risk and return Assume a two-stock portfolio is created with $50,000 invested in both HT and Collections. • Expected return of a portfolio is a weighted average of each of the component assets of the portfolio. • Standard deviation is a little more tricky and requires that a new probability distribution for the portfolio returns be devised.
An alternative method for determining portfolio expected return
Comments on portfolio risk measures • σp = 3.3% is much lower than the σi of either stock (σB = 20.0%; σC. = 13.4%). • σp = 3.3% is lower than the weighted average of B and C’s σ (16.7%). • \ Portfolio provides average return of component stocks, but lower than average risk.