Download
1 / 55
570 likes | 796 Vues
Risk and Rates of Return. Managerial Finance I Keldon Bauer, PhD. Introduction. We have focused some attention on expected return. But how does risk alter the value of assets?. Defining/Measuring Risk. Risk is often though of as the “possibility of loss or injury.”

E N D
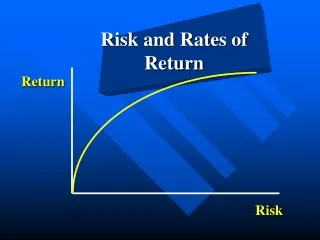
Risk and Rates of Return Managerial Finance I Keldon Bauer, PhD
Introduction • We have focused some attention on expected return. • But how does risk alter the value of assets?
Defining/Measuring Risk • Risk is often though of as the “possibility of loss or injury.” • To many, financial risk may be seen as investing in a risky stock. • Is it reallythe same as gambling in Mesquite?
Defining/Measuring Risk • In finance, risk means uncertainty of outcome (stocks versus T-bills). • Chance of receiving an actual return other than expected. • For example we could look at the annual return of stocks, T-bonds and T-bills.
Defining/Measuring Risk • Expected Return as defined in statistics is as follows:
Defining/Measuring Risk • Risk in statistics (and financial economics) is measured by standard deviation, which measures the tightness of the results.
Defining/Measuring Risk • If we assume that the return on two companies would be as follows:
Defining/Measuring Risk Martin Manufacturing:
Defining/Measuring Risk US Utility:
Defining/Measuring Risk Using m and s to Approximate a Normal Distribution:
Measuring Stand-Alone Risk • If investors have invested everything in one investment, then standard deviation should be standardized by expected return.
Measuring Stand-Alone Risk The lower the CV the lower the return adjusted risk.
Risk Aversion • Assuming that you need to live off of your investment, and you can only invest in one of the two companies from the previous slides, which would it be? • Martin Manufacturing • US Utility
Risk Aversion • If you chose US Utility, you are risk averse. • Risk averse investors require higher rates of return to invest in riskier assets. • It is assumed that all investors are risk averse: • If two assets offer the same return, they will opt for the less risky.
Risk Premium • The amount of additional return required by a riskier asset to make that asset equally desirable by the market in general is called a risk premium. • When the market perceives that one asset is riskier than another, it requires that the expected return increase to compensate investors for the risk.
Portfolio Returns • In the real world, investors can hold more than one investment. • But risk is still important in pricing assets given their expected return.
Portfolio Returns • Risk and return should not be evaluated in isolation. Each security should be evaluated in its risk/return trade-off to the portfolio. • Portfolio expected return:
Portfolio Returns - Example • Given the following portfolio of stocks:
Portfolio Risk • Unlike portfolio return, which is just a weighted average return of all returns in the portfolio, portfolio standard deviation is much more complicated.
Portfolio Risk • It depends on the weight (wi) of the new asset to the overall portfolio. • It depends on the standard deviation (si) of the new asset’s returns. • It depends on the correlation (rij) between the new asset and all other assets in the portfolio.
Correlation Coefficient • rij is a measure of the degree of relationship between two variables. • It ranges from -1 to +1. • For rij<1, overall portfolio risk decreases. • Which is why risk goes down as number of stocks in a portfolio goes up. • For rij=-1, portfolio risk could be eliminated.
Portfolio Risk Reduction • Risk can only be reduced so far. • Almost all stocks are positively correlated. • As the number of stocks increase, the risk approaches sm.
Capital Asset Pricing Model • CAPM shows return is a function of only the systematic risk. • Unsystematic risk can be reduced through diversification. • CAPM is used to determine the required rate of return. • Measured by degree of “correlation” with the market.
Capital Asset Pricing Model • bj is a measure of a stock’s sensitivity to market fluctuations. • When bj = 1, equal volatility with market. • Only measures systematic risk.
Capital Asset Pricing Model • Risk has two components • Market and firm-specific risks. • Firm specific risk can be eliminated through diversification. • Market risk cannot be eliminated. • Therefore, one must be compensated to hold market (systematic) risk.
Capital Asset Pricing Model • The greater the systematic risk, the higher return will be required by the market. • The beta (regression) coefficient measures systematic risk. • Because beta determines how the stock affects the riskiness of a diversified portfolio, beta is the most relevant measure of a stock’s risk!
Portfolio Beta Coefficients • Like expected return, the portfolio beta, bp, is a weighted average of individual stock b’s.
Portfolio Beta Coefficients • Given the following stocks:
Portfolio Risk/Return • We have talked about expected return. • Now we will talk of required return, required by efficient economic markets.
Portfolio Risk/Return • Term definitions:
Portfolio Risk/Return - Example • If the market portfolio is expected to earn 14%, the risk-free rate is 6% and Wasup Dot.com has a beta of 2.
Portfolio Risk/Return - Example • Earlier, we said that this stock had an expected return of 30%. • Based on a required return of 22%, should you buy or sell? • Buy - It is under-priced!!!
The Security Market Line - SML • If we allow the x-axis to represent bj, and the y-axis to represent the required return, kj, the resulting graph is called the Security Market Line - SML. • Note that kRF is the intercept. • Note that (kM-kRF), or market risk premium, is the slope.
Impact of Inflation on SML • In chapter 2, we said that inflationary expectation are embedded in interest rates (as inflation is expected to go up - interest goes up). • The risk premium is expected to stay constant over time.
Impact of Risk Aversion on SML • If there were no risk aversion, all assets would earn the same return. • As risk aversion increases, the risk premium (the slope of the line) increases.