Download
1 / 31
320 likes | 520 Vues
Chapter 8. Risk and Rates of Return. Historical Risk and Return Info. Based on annual returns from 1926-2004 Avg. Return Std Dev. Small Stocks 17.5% 33.1% Large Co. Stocks 12.4% 20.3% L-T Corp Bonds 6.2% 8.6% L-T Govt. Bonds 5.8% 9.3% U.S. T-Bills 3.8% 3.1%.

E N D
Chapter 8 Risk and Rates of Return
Historical Risk and Return Info. • Based on annual returns from 1926-2004 Avg. ReturnStd Dev. Small Stocks 17.5% 33.1% Large Co. Stocks 12.4% 20.3% L-T Corp Bonds 6.2% 8.6% L-T Govt. Bonds 5.8% 9.3% U.S. T-Bills 3.8% 3.1%
Chapter 8 Risk & Rates of Return • Risk: The Big Picture • Expected Return • Stand Alone Risk • Portfolio Return and Risk • Risk Diversification • Market Risk • Beta • CAPM/Security Market Line Equation (SML)
What is Risk? The big picture. • Risk is an uncertain outcome or chance of an adverse outcome. • Concerned with the riskiness of cash flows from financial assets. • Stand Alone Risk: Single Asset • relevant risk measure is the total risk of expected cash flows measured by standard deviation .
Risk: The Big Picture (cont.) • Portfolio Context: A group of assets. Total risk consists of: • Diversifiable Risk (company-specific, unsystematic) • Market Risk (non-diversifiable, systematic) • Small group of assets with Diversifiable Risk remaining: interested in portfolio standard deviation. • correlation ( or r) between asset returns which affects portfolio standard deviation
finishing the Big Picture on Risk Well-diversified Portfolio • Large Portfolio (10-15 assets) eliminates diversifiable risk for the most part. • Interested in Market Risk which is the risk that cannot be diversified away. • The relevant risk measure is Beta which measures the riskiness of an individual asset in relation to the market portfolio.
Holding Period (Realized) Return HPR = (End of Period Price - Beginning Price + Dividends)/Beginning Price HPR = Capital Gains Yield + Dividend Yield HPR = (P1-P0)/P0 + D/P0 Example: Bought at $50, Receive $3 in dividends, current price is $54 HPR = (54-50+3)/50 = .14 or 14% CGY = 4/50 = 8%, DY = 3/50 = 6%
Expected Return: Single Asset • Expected Rate of Return given a probability distribution of possible returns(ri): E(r) n E(r) = Pi ri i=1 • Realized or Average Return on Historical Data: - n r = 1/n ri i=1
Standard Deviation • Relevant Risk Measure for single asset Variance = 2 = (ri - E(r))2 Pi • Standard Deviation = Square Root of Variance • Historical Variance = 2 = 1/nS(ri – rAVG )2 • Sample Variance = s2 = 1/(n-1) S(ri – rAVG )2
Decision Time: Coefficient of Variation • Most investors are Risk Averse, meaning they don’t like risk and demand a higher return for bearing more risk. • The Coefficient of Variation (CV) scales risk per unit of expected return. • CV = /E(r) • CV is a measure of relative risk, where standard deviation measures absolute risk.
Back to our Example: CV • MAD Inc. • E(r) = 33.5% • = 34.0% • CV = 34%/33.5% • CV = 1.015 • Contrary Co. • E(r) = 7.5% • = 8.5% • CV = 8.5%/7.5% • CV = 1.133
Portfolio Risk and Return • E(rp) = wiE(ri) = weighted average of the expected return of each asset in the portfolio • In our example, MAD E(r) = 33.5% and CON E(r) = 7.5% • What is the expected return of a portfolio consisting of 60% MAD and 40% CON? • E(rp) = wiE(ri) = .6(33.5%) + .4(7.5%) = 23.1%
Portfolio Risk • Looking at a 2-asset portfolio for simplicity, the riskiness of a portfolio is determined by the relationship between the returns of each asset over different states of nature or over time. • This relationship is measured by the correlation coefficient( r ): -1<= r < =+1 • All else constant: Lower r = less portfolio risk
Example Portfolio • Each MAD-CON ri = .6(MAD)+.4(CON); • E(Rp)= 23.1%
As you add stocks to your portfolio, diversifiable risk is reduced.
Market Risk • As more and more assets are added to a portfolio, risk measured by decreases. • However, we could put every conceivable asset in the world into our portfolio and still have risk remaining. (See Fig. 8-8, pg. 265) • This remaining risk is called Market Riskand is measured by Beta.
The Concept of Beta • Beta(b) measures how the return of an individual asset (or even a portfolio) varies with the market. • b = 1.0 : same risk as the market • b < 1.0 : less risky than the market • b > 1.0 : more risky than the market • Beta is the slope of the regression line (y = a + bx) between a stock’s return(y) and the market return(x) over time, b from simple linear regression. • Sources for stock betas: ValueLine Investment Survey (at BEL), Yahoo Finance, MSN Money, Standard & Poors
Relating Market Risk and Return: the CAPM and SML equation • The story is the same as Chapter 6: a stock’s required rate of return = nominal risk-free rate + the stock’s risk premium. • The main assumption is investors hold well diversified portfolios = only concerned with market risk. • A stock’s risk premium = measure of market risk X market risk premium.
SML Equation • RPM = market risk premium = rM - rRF • RPi = stock risk premium = (RPM)bi • ri = rRF + (rM - rRF )bi = rRF + (RPM)bi
CAPM Example • What is Intel’s required return if its B = 1.2 (from ValueLine Investment Survey), the current 3-mo. T-bill rate is 5%, and the historical US market risk premium of 8.6% is expected?
Portfolio Beta • The beta of a portfolio of stocks is equal to the weighted average of their individual betas: bp = wibi • Example: What is the portfolio beta for a portfolio consisting of 25% Home Depot with b = 1.0, 40% Hewlett-Packard with b = 1.35, and 35% Disney with b = 1.25. What is this portfolio’s required (expected) return if the risk-free rate is 5% and the market expected return is 14%?
Continuing our Example • AT&T currently sells for $36.50. Should we add AT&T with an expected price and dividend in a year of $39.54 & $1.42 and a b = 1.2 to our portfolio? • To make our decision find AT&T’s expected return using the holding period return formula and compare to AT&T’s SML return. • Recall that rRF = 5% and rM = 14%
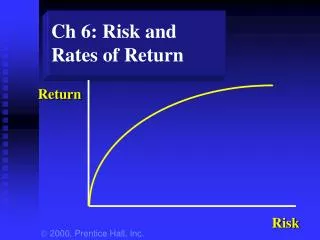
The Security Market Line (SML) • A graphical representation of the CAPM/SML equation. • Gives required (expected) returns for investments with different betas. • Y axis = expected return, X axis = beta • Intercept = risk-free rate = 3-month T-bill rate (B = 0) • Slope of SML = market risk premium • For the following SML graph, let’s use a 3-month T-bill rate of 5% and assume investors require a market return of 14%. • Graph r = 5% + B(14%-5%) • Market risk premium = 14% - 5% = 9%
Changes to SML Equation • What happens if inflation increases? • What happens if investors become more risk averse about the stock market? • Check out the following graphs with our base SML = 5% + (14%-5%)b
SML change, increase in inflation and rRF: rRF = 7%, rM = 16%
SML increase in risk aversion (market risk premium: rRF = 5%, rM = 16%
Finding Beta using Excel. • There are two functions in Excel that will find the X coefficient (beta). • The functions are LINEST and SLOPE. • The format is =LINEST(y range,x range) • The above format is the same for SLOPE. • Remember the stock’s returns is the y range, and the market’s returns is the x range.