Download
1 / 39
390 likes | 610 Vues
Risk and Rates of Return. What does it mean to take risk when investing? How are risk and return of an investment measured? For what type of risk is an average investor rewarded? How can investors reduce risk?

E N D
Risk and Rates of Return • What does it mean to take risk when investing? • How are risk and return of an investment measured? • For what type of risk is an average investor rewarded? • How can investors reduce risk? • What actions do investors take when the return they require to purchase an investment is different from the return the investment is expected to produce?
RISK AND RATES OF RETURN • Definitions and General Concepts • Probability Distributions • Expected return • Standard deviation, • Risk Attitudes • Coefficient of Variation • Portfolio Risk and Return • Diversification • Relevant risk • Beta coefficients • Determining Return—Capital Asset Pricing Model • Real (Physical) Assets Versus Financial Assets
What is Risk? • Dictionary definition—chance of loss • In finance we define risk as the chance that something other than what is expected occurs—that is, variability of returns • Risk can be considered “bad”—that is, when the results are worse than expected (lower-than-expected returns)—or “good”—that is, when the results are better than expected (higher-than-expected returns) • Dictionary definition—chance of loss • In finance we define risk as the chance that something other than what is expected occurs—that is, variability of returns • Dictionary definition—chance of loss • In finance we define risk as the chance that something other than what is expected occurs—that is, variability of returns • Dictionary definition—chance of loss
Risk • Stand-alone risk—risk of an investment if it was held by itself, or alone • Portfolio risk—risk of an investment when it is combined in a portfolio with other investments
Risk • We know that an investment is risky if more than one future outcome is possible—that is, there are two or more possible payoffs associated with the investment • A probability distribution summarizes each possible outcome along with the chance, or probability, that the outcome will occur
Probability Distributions—Example EconomyProbabilityPayoff Booming0.218.0% Normal0.58.0 Recession0.3-2.0 EconomyProbabilityPayoff Booming0.218.0% Normal0.58.0 Recession0.3-2.0 1.0 RiskyRisk-Free EconomyProbabilityAsset Asset Booming0.218.0%5.0% Normal0.58.05.0 Recession0.3-2.05.0 1.0
Risk-Free Asset Probability Probability Investment A 0.5 0.5 0.4 0.4 0.3 0.3 0.2 0.2 Investment B 0.1 0.1 -2 0 5 8 10 15 18 -2 0 5 8 10 15 18 -5 -5 Return (%) Return (%) Probability Distributions Discrete Distributions Continuous Distributions
Expected Return • Weighted average of the various possible outcomes based on the probability that each outcome will occur • Average of the outcomes if the action—for example, an investment—was continued over and over again and the probability for each outcome remained the same—that is, the probability distribution does not change
Expected rate ˆ L = = + + + r r r r Pr Pr Pr of return 1 1 2 2 n n n å = Pr r i i = i 1 Expected Return ri= the result of outcome i Pri= the probability that outcome i will occur
Economy Probability, Pri Payoff, ri Prix r Boom 0.2 18.0% 3.6% Normal 0.5 8.0 4.0 Recession 0.3 -2.0 -0.6 7.0% Expected Return Boom0.218.0%3.6% Normal0.58.04.0 Recession0.3-2.0-0.6
Measuring Stand-Alone RiskStandard Deviation, • Measures the tightness, or variability, of a set of outcomes, or a probability distribution • The tighter the distribution, the less the variability of the outcomes and the less risk associated with the event • Measures risk for a single investment—that is an investment held by itself (standing alone)
ˆ ˆ ˆ - + - + + - 2 2 2 2 = ( r r ) Pr ( r r ) Pr ( r r ) Pr s L 1 1 2 2 n n n å ˆ = - 2 ( r r ) Pr i i i = 1 Measuring Stand-Alone RiskStandard Deviation, Variance, 2—measures the variability of outcomes Standard deviation,
ri–= ri– (ri– )2 xPri (ri– )2Pri Standard Deviation, 18.0% 18.0%–7.0% 18.0%–7.0%=11.0% 18.0%–7.0%=11.0%121.0 18.0%–7.0%=11.0%121.0x0.2 18.0%–7.0%=11.0%121.0x0.2=24.2 8.0–7.0=1.01.0x0.5=0.5 -2.0–7.0=-9.081.0x0.3=24.3 8.0–7.0=1.01.0x0.5=0.5 -2.0–7.0=-9.081.0x0.3=24.3 2=49.0
Risk Attitudes • Risk Aversion—all else equal, risk averse investors prefer higher returns to lower returns as well as less risk to more risk • Risk averse investors demand higher returns for investments with higher risk
Return Risk 0 Risk Aversion Risk Premium = RP r = rRF + RP rRF Risk-Free Return = rRF
Coefficient of Variation • Measures the relationship between risk and return • Allows for comparisons among various investments that have different risks and different returns
Payoffs EconomyProbability A B C Boom 0.2 18.0% -5.0% 55.0% Normal 0.5 8.0 7.0 14.0 Recession 0.3 -2.0 15.0 -10.0 Expected return, 7.0% Payoffs EconomyProbability A B C Boom 0.2 18.0% -5.0% 55.0% Normal 0.5 8.0 7.0 14.0 Recession 0.3 -2.0 15.0 -10.0 Expected return, 7.0% 7.0% Payoffs EconomyProbability A B C Boom 0.2 18.0% -5.0% 55.0% Normal 0.5 8.0 7.0 14.0 Recession 0.3 -2.0 15.0 -10.0 Expected return, 7.0% 7.0% 15.0% Payoffs EconomyProbability A B C Boom 0.2 18.0% -5.0% 55.0% Normal 0.5 8.0 7.0 14.0 Recession 0.3 -2.0 15.0 -10.0 Expected return, 7.0% 7.0% 15.0% Standard deviation, 7.0% 6.9% 22.5% Payoffs EconomyProbability A B C Boom 0.2 18.0% -5.0% 55.0% Normal 0.5 8.0 7.0 14.0 Recession 0.3 -2.0 15.0 -10.0 Expected return, 7.0% 7.0% 15.0% Standard deviation, 7.0% 6.9% 22.5% Coeff of variation, CV 1.00 0.99 1.50 Coefficient of Variation EconomyProbability A Boom0.218.0% Normal0.58.0 Recession0.3-2.0 Payoffs EconomyProbability A B C Boom0.218.0%-5.0%55.0% Normal0.58.07.014.0 Recession0.3-2.015.0-10.0
Portfolio Risk • By combining investments to form a portfolio, or collection of investments, diversification can be achieved • When evaluated in a portfolio, the performance of a single investment is not very important, because some investments will perform better than expected while others will perform worse than expected • The performance of the portfolio as a whole is important
Portfolio Return Expected return of a portfolio = weighted average of the expected returns of the individual investments in the portfolio wj = proportion of funds invested in Asset j
Payoffs Probability A B Boom 0.2 18.0% -5.0% Norm 0.5 8.0 7.0 Recess 0.3 -2.0 15.0 7.0% 7.0% 7.0% 6.9% CV 1.00 0.99 Portfolio Return PayoffsPortfolio Probability A B wA=0.6; wB=0.4 0.218.0%-5.0% 0.58.07.0 0.3-2.015.0 7.0%7.0% 7.0%6.9% CV1.000.99 PayoffsPortfolio Probability A B wA=0.6; wB=0.4 0.218.0%-5.0%18(0.6) + (-5)(0.4)= 8.8 0.58.07.0 0.3-2.015.0 7.0%7.0% 7.0%6.9% CV1.000.99 PayoffsPortfolio Probability A B wA=0.6; wB=0.4 0.218.0%-5.0%18(0.6) + (-5)(0.4)= 8.8 0.58.07.08(0.6) + 7(0.4) = 7.6 0.3-2.015.0 7.0%7.0% 7.0%6.9% CV1.000.99 PayoffsPortfolio Probability A B wA=0.6; wB=0.4 0.218.0%-5.0%18(0.6) + (-5)(0.4)= 8.8 0.58.07.08(0.6) + 7(0.4) = 7.6 0.3-2.015.0 (-2)(0.6) + 15(0.4)= 4.8 7.0%7.0% 7.0%6.9% CV1.000.99 PayoffsPortfolio Probability A B wA=0.6; wB=0.4 0.218.0%-5.0%18(0.6) + (-5)(0.4)= 8.8 0.58.07.08(0.6) + 7(0.4) = 7.6 0.3-2.015.0 (-2)(0.6) + 15(0.4)= 4.8 7.0%7.0% 7(0.6) + 7(0.4)= 7.0 7.0%6.9% CV1.000.99 PayoffsPortfolio Probability A B wA=0.6; wB=0.4 0.218.0%-5.0%18(0.6) + (-5)(0.4)= 8.8 0.58.07.08(0.6) + 7(0.4) = 7.6 0.3-2.015.0 (-2)(0.6) + 15(0.4)= 4.8 7.0%7.0% 7(0.6) + 7(0.4)= 7.0 7.0%6.9%1.5 CV1.000.990.22
Portfolio Risk—Diversification • When investments that are not perfectly correlated—that is, do not mirror each others’ movements on a relative basis—are combined to form a portfolio, the risk of the portfolio can be reduced (diversification) • The amount of the risk reduction depends on how the investments in a portfolio are related • The smaller (greater) the positive (negative) relationship among the various investments included in a portfolio, the greater the diversification • Diversification—investing in a combination of stocks generally reduces risk overall
Risk Stand-alone risk = Stand-alone risk = = total risk = firm-specific risk Stand-alone risk = = total risk Stand-alone risk = = total risk = firm-specific risk+ market risk Stand-alone risk = = total risk = firm-specific risk+ market risk =diversifiable Stand-alone risk = = total risk = firm-specific risk+ market risk =diversifiable+ nondiversifiable
Firm-Specific Risk • Caused by actions that are specific to the firm—management decisions, labor characteristics, etc. • The impact of this type of risk on the expected return associated with an investment is generally fairly random • This risk component is often called unsystematic risk • This risk is also called diversifiable risk, because this portion of total risk can be reduced in a portfolio of investments
Market Risk • Results from movements in factors that affect the economy as a whole—interest rates, employment, etc. • This risk affects all companies, thus all investments; it is a system wide risk that cannot be diversified away • This risk is called systematic, or nondiversifiable, risk • Even though all investments are affected by systematic risk, they are not all affected to the same degree
Relevant Risk • Risk that cannot be reduced or diversified away • Relevant risk = systematic, or market risk • “Irrelevant” risk = firm-specific, or unsystematic risk, because this portion of total risk can be reduced through diversification • Investors should not be rewarded for taking “irrelevant” risk—that is, for not diversifying • Risk premiums are based on the amount of systematic risk associated with an investment
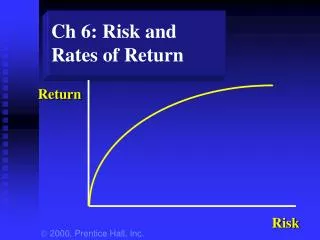
Return Risk Premium based on systematic risk rRF Risk-Free Return Risk (systematic) 0 Relevant Risk r = rRF + RP
Concept of Beta • Market, or systematic, risk is measured by comparing the return on an investment with the return on the market in general, or an average stock • The market is very well diversified so that any movements should be the result on systematic risk only • Beta coefficient, β—measures the relationship between an individual investment’s returns and the market’s returns, thus the systematic risk of the investment
Return on the .. Stock, r j . . . . . . . . b = slope . . . . Return on the .. Market, r M Concept of Beta
Portfolio Beta Coefficients • Aportfolio’sbeta,βpisafunctionofthebetasoftheindividualinvestmentsintheportfolio • Aportfoliobetaistheweightedaverageofthebetasassociatedwiththeindividualinvestmentscontainedintheportfolio wj=%oftotalfundsinvestedinassetj βj=assetj’sbetacoefficient
Amount Investment Invested Beta, j Amount Investment Invested Beta, j Weight, wjjx wj Amount Investment Invested Beta, j Weight, wj Amount Investment Invested Portfolio Beta Coefficients—Example Stock A$ 30,000 Stock B20,000 Stock C10,000 Stock D 40,000 100,000 Stock A$ 30,0002.0 Stock B20,000 Stock C10,000 Stock D 40,000 100,000 Stock A$ 30,0002.0 Stock B20,0001.5 Stock C10,000 Stock D 40,000 100,000 Stock A$ 30,0002.0 Stock B20,0001.5 Stock C10,0001.0 Stock D 40,000 100,000 Stock A$ 30,0002.0 Stock B20,0001.5 Stock C10,0001.0 Stock D 40,0000.5 100,000 Stock A$ 30,0002.00.3 Stock B20,0001.5 Stock C10,0001.0 Stock D 40,0000.5 100,000 Stock A$ 30,0002.00.3 Stock B20,0001.50.2 Stock C10,0001.00.1 Stock D 40,0000.50.4 100,000 Stock A$ 30,0002.00.3 Stock B20,0001.50.2 Stock C10,0001.00.1 Stock D 40,0000.50.4 100,0001.0 Stock A$ 30,0002.00.30.6 Stock B20,0001.50.2 Stock C10,0001.00.1 Stock D 40,0000.50.4 100,0001.0 Stock A$ 30,0002.00.30.6 Stock B20,0001.50.20.3 Stock C10,0001.00.10.1 Stock D 40,0000.50.40.2 100,0001.0 Stock A$ 30,0002.00.30.6 Stock B20,0001.50.20.3 Stock C10,0001.00.10.1 Stock D 40,0000.50.40.2 100,0001.0p=1.2
Relationship between Risk and Rates of Return • Market risk premium = RPM = rM - rRF • RPM = return associated with the riskiness of a portfolio that contains all the investments in the market • RPM is based on how risk averse investors are on average • Because an investment’s beta coefficient indicates volatility relative to the market, we can use β to determine the risk premium for an investment • Investment risk premium = RPInvest = RPMx βInvest • A more volatile investment—that is, an investment with a higher β—will earn a higher return than a less volatile investment
Relationship between Risk and Rates of Return Return = Risk-free rate + Risk Premium rInvest= rRF+ RPInvest = rRF+ ( RPM ) βInvest =rRF+ ( rM – rRF ) βInvest Capital Asset Pricing Model (CAPM) 5.0 6.0 = 11.0 5.0 1.5 4.0 5.0 9.0 5.0 1.5 j = 1.5 rRF = 5.0% rM = 9%
Return, % Risk Premium based on rM rRF Risk-Free Return 0 Risk—Measured by 1.0 CAPM Graph—SML Security Market Line, SML RPM rj = rRF + RPMj
Return, % Return, % Risk Premium based on Risk Premium based on RPM2 = 4 rM1 = 10 rM1 = 10 rRF2 = 8 RPM1 = 4 rRF1 = 6 rRF1 = 6 Risk-Free Return Risk-Free Return 0 0 Risk—Measured by Risk—Measured by 1.0 1.0 CAPM—Inflation Effects r1= 6 + 4(1.5) = 12 r2= 8 + 4(1.5) = 14 rM2 = 12 rRF2 = 8
Return, % Return, % Risk Premium based on rM1 = 10 Risk Premium based on rM1 = 10 RPM1 = 4 rRF = 6 rRF = 6 Risk-Free Return Risk-Free Return 0 Risk—Measured by 1.0 0 Risk—Measured by 1.0 RPM2 = 5 CAPM—Changes in Risk Aversion r1= 6 + 4(1.5) = 12.0 r2= 6 + 5(1.5) = 13.5 rM2 = 11
Return, % Risk Premium based on rM = 10 RPM = 4 rRF = 6 Risk-Free Return 0 Risk—Measured by 1.0 CAPM—Changes in Beta rB2 = 11 rB1 = 12 1.5 1.25
If the required rate of return, rs, and the expected rate of return, , are not equal, then the price of the investment will change until . Changes in Equilibrium Stock Prices • Stock prices are not constant due to changes in rRF, RPM, bx, and so forth.
Risk and Rates of Return • What does it mean to take risk when investing? • More than one outcome is possible • How are risk and return of an investment measured? • Variability of its possible outcomes; greater variability = greater risk • How can investors reduce risk? • Risk can be reduced through diversification
Risk and Rates of Return • For what type of risk is an average investor rewarded? • Investors should only be rewarded for risks they must take • What actions do investors take when the return they require to purchase an investment is different from the return the investment is expected to produce? • Investors will purchase a security only when its expected return is greater than or equal to its required return