Download
1 / 124
1.24k likes | 1.38k Vues
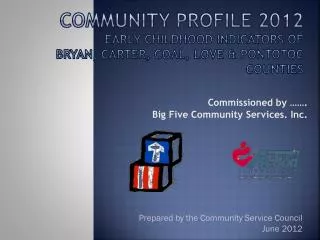
This report, commissioned by Big Five Community Services, presents a comprehensive analysis of demographic trends, economic conditions, and early childhood indicators for Bryan, Carter, Coal, Love, and Pontotoc Counties as of June 2012. It outlines significant changes in population dynamics, migration patterns, economic employment trends, and self-sufficiency wage comparisons to poverty guidelines. The data provides valuable insights for community planning and policy-making aimed at enhancing early childhood development and economic stability in these regions.

E N D
Community Profile 2012Early Childhood Indicators of Bryan, Carter, coal, Love & pontotoc Counties Commissioned by ……. Big Five Community Services. Inc. Prepared by the Community Service Council June 2012
Bryan, carter, coal, love & pontotoc Counties • Demographic Trends • Economics and Employment • Child Indicators
Demographic Trends • Population change--migration to suburban areas of Tulsa and Oklahoma City MSA with an overall decrease in new births • Age--aging population • Race and ethnicity--more culturally diverse • Living arrangements--transitional for family living arrangement DEMOGRAPHIC TRENDS
Comparison of self-sufficiency wage to poverty guidelines, by size of familyBryan county, 2012 ECONOMICS & EMPLOYMENT Notes: For the self-sufficiency wages shown in table, family of two consists of one adult and one preschooler; family of three consists of one adult, one preschooler and one schoolage child; family of four consists of two adults, one preschooler and one schoolage child. Hourly wages given assume full-time, year-round employment. Source: Oklahoma Association of Community Action Agencies and the Oklahoma Asset Building Coalition, December 2009, The Self-Sufficiency Standard for Oklahoma 2009; 2012 HHS Poverty Guidelines, Federal Register, Vol. 77, No. 13, January 26, 2012, p. 3637-3638. Bureau of Labor Statistics, May 2012.
Comparison of self-sufficiency wage to poverty guidelines, by size of familycarter county, 2012 ECONOMICS & EMPLOYMENT Notes: For the self-sufficiency wages shown in table, family of two consists of one adult and one preschooler; family of three consists of one adult, one preschooler and one schoolage child; family of four consists of two adults, one preschooler and one schoolage child. Hourly wages given assume full-time, year-round employment. Source: Oklahoma Association of Community Action Agencies and the Oklahoma Asset Building Coalition, December 2009, The Self-Sufficiency Standard for Oklahoma 2009; 2012 HHS Poverty Guidelines, Federal Register, Vol. 77, No. 13, January 26, 2012, p. 3637-3638. Bureau of Labor Statistics, May 2012.
Comparison of self-sufficiency wage to poverty guidelines, by size of familycoal county, 2012 ECONOMICS & EMPLOYMENT Notes: For the self-sufficiency wages shown in table, family of two consists of one adult and one preschooler; family of three consists of one adult, one preschooler and one schoolage child; family of four consists of two adults, one preschooler and one schoolage child. Hourly wages given assume full-time, year-round employment. Source: Oklahoma Association of Community Action Agencies and the Oklahoma Asset Building Coalition, December 2009, The Self-Sufficiency Standard for Oklahoma 2009; 2012 HHS Poverty Guidelines, Federal Register, Vol. 77, No. 13, January 26, 2012, p. 3637-3638. Bureau of Labor Statistics, May 2012.
Comparison of self-sufficiency wage to poverty guidelines, by size of familylove county, 2012 ECONOMICS & EMPLOYMENT Notes: For the self-sufficiency wages shown in table, family of two consists of one adult and one preschooler; family of three consists of one adult, one preschooler and one schoolage child; family of four consists of two adults, one preschooler and one schoolage child. Hourly wages given assume full-time, year-round employment. Source: Oklahoma Association of Community Action Agencies and the Oklahoma Asset Building Coalition, December 2009, The Self-Sufficiency Standard for Oklahoma 2009; 2012 HHS Poverty Guidelines, Federal Register, Vol. 77, No. 13, January 26, 2012, p. 3637-3638. Bureau of Labor Statistics, May 2012.
Comparison of self-sufficiency wage to poverty guidelines, by size of familypontotoc county, 2012 ECONOMICS & EMPLOYMENT Notes: For the self-sufficiency wages shown in table, family of two consists of one adult and one preschooler; family of three consists of one adult, one preschooler and one schoolage child; family of four consists of two adults, one preschooler and one schoolage child. Hourly wages given assume full-time, year-round employment. Source: Oklahoma Association of Community Action Agencies and the Oklahoma Asset Building Coalition, December 2009, The Self-Sufficiency Standard for Oklahoma 2009; 2012 HHS Poverty Guidelines, Federal Register, Vol. 77, No. 13, January 26, 2012, p. 3637-3638. Bureau of Labor Statistics, May 2012.
Ratio of income to poverty levelnumber of persons: total population and childrenstate of oklahoma and Bryan and carter counties, 2006-10 estimates ECONOMICS & EMPLOYMENT Note: Values shown are midpoint estimates within a 90% confidence range, which can be very wide. Estimates with margins of error exceeding +/- 10% of estimate are shown in italics. Source: US Census Bureau, 2006-10 American Community Survey.
Ratio of income to poverty levelnumber of persons: total population and childrencoal, love and pontotoc counties, 2006-10 estimates ECONOMICS & EMPLOYMENT Note: Values shown are midpoint estimates within a 90% confidence range, which can be very wide. Estimates with margins of error exceeding +/- 10% of estimate are shown in italics. Source: US Census Bureau, 2006-10 American Community Survey.
Ratio of income to poverty level total populationbryan, carter, coal, love and pontotoc counties, 1989, 1999 & 2006-10 estimates ECONOMICS & EMPLOYMENT Note: Values shown are midpoint estimates within a 90% confidence range, which can be very wide. Estimates with margins of error exceeding +/- 10% of estimate are shown in italics. Source: US Census Bureau, 2006-10 American Community Survey.
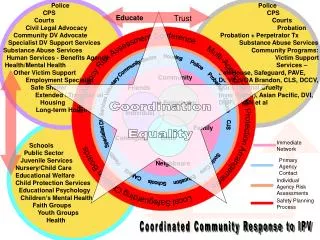
The Adverse Childhood Experiences (ACE) Study Pyramid Death CHILD INDICATORS Conception Mechanisms by which Adverse Childhood Experiences Influence Health and Well-being throughout the Lifespan Source: The Adverse Childhood Experiences Study website: www.acestudy.org, “About the Adverse Childhood Experiences Study.”