Download
1 / 35
350 likes | 695 Vues
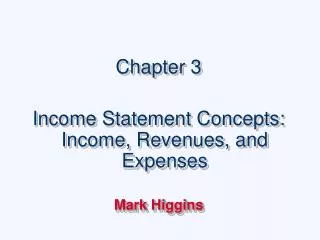
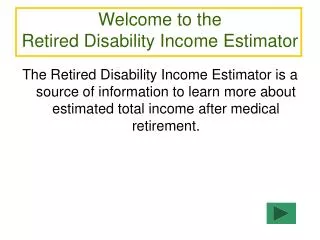
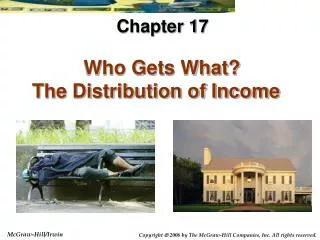
Who Gets What? The Distribution of Income. Chapter 17. Today’s lecture will:. Explain what a Lorenz curve is. Discuss how the poverty definition is both an absolute and a relative measure. Present U.S. income inequality in a global context.

E N D
Who Gets What?The Distribution of Income Chapter 17
Today’s lecture will: • Explain what a Lorenz curve is. • Discuss how the poverty definition is both an absolute and a relative measure. • Present U.S. income inequality in a global context. • Discuss two alternative ways to describe the distribution of income.
Today’s lecture will: • Explain three problems in determining whether an equal distribution of income is fair. • Present three side effects of redistributing income. • Summarize the U.S. tax and expenditure programs to redistribute income.
Ways of Considering the Distribution of Income • Share distribution of income is the relative division of total income among income groups. • For example, it measures how much income the top 5% get. • Socioeconomic distribution of income is the allocation of income among relevant socioeconomic groups. • For example, how much do women get compared to men?
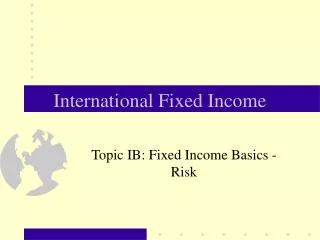
The Lorenz Curve • A Lorenz curve is a geometric representation of the size distribution of income among families in a given nation at a given time. • A perfectly equal distribution of income is represented by a diagonal line. • An unequal distribution of income is represented by a Lorenz curve that is below the diagonal line.
Lowest fifth Second fifth Third fifth Fourth fifth Highest fifth Lorenz Curve of U.S. Income, 2003 C 100 J Percentage of Total Family Income Cumulative Percentage of Total Family Income Income Quintile 80 60 3.4 % 3.4% I Cumulative percentage of income 8.7 12.1 B 40 14.8 26.9 H A 23.4 50.3 G 20 F 49.8 100.0 0 20 40 60 80 100
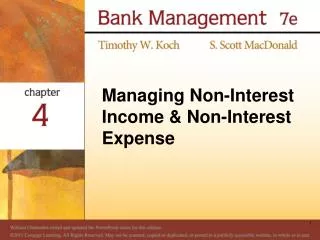
U.S. Income Distribution Over Time • Up to 1970, equality increased because: • Welfare programs • Unemployment insurance • Social security • Progressive taxation • Improved macroeconomic performance of the economy
U.S. Income Distribution Over Time • From 1970 until 2003, income inequality increased because: • Taxes have become less progressive. • Government funding for social programs has fallen. • The wages of unskilled and medium skilled and unskilled workers have been squeezed by an influx of immigrants who are willing to work for low wages and global competition.
100% 80 60 Cumulative percentage of income 1970 40 1929 2003 20 0 40 20 60 80 100% Cumulative percentage of population Lorenz Curve for the U.S. 1929, 1970, and 2003 Line of absolute equality
Defining Poverty • The poverty threshold is the income below which a family is considered to live in poverty. • The U.S. government definition of poverty is a combination of a relative and an absolute measure. • Equal to or less than three times and average family’s USDA-calculated minimum food expenditures. • The food budget definition was established in the 1960s and is not recalculated to account for rising standards of living.
The Official Definition of Poverty • The number of people in poverty: • Decreased during the 1960s. • Increased during the 1970s through the early 1990s. • Decreased during the mid through late 1990s. • Increased in the early 2000s.
Debates About the Definition of Poverty • Food prices are adjusted for inflation meaning the definition includes significant aspects of relativity. • Those favoring a relative measure of poverty would multiply the food figure by roughly four rather than three. • Those favoring an absolute measure argue that the current measure is too high because poverty figures do not include noncash assistance or assets or savings recipients may have.
The Cost of Poverty • Some feel that society suffers when some of its people are in poverty. • When poverty decreases, the incentives for crime also decrease. • Some people argue that poverty increased as a result of government tax and spending policies that favor the wealthy. • Others argue that it is the result of demographic changes, such as the increase in single-parent families.
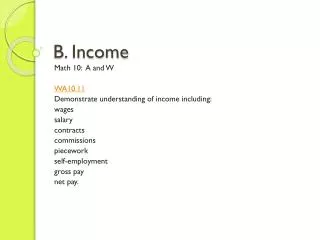
100 80 60 Cumulative percentage of income Sweden 40 Japan United States 20 Brazil 0 20 40 60 80 100 Cumulative percentage of population U.S. Income Distribution Compared to Other Countries
Comparing Income Distribution with Other Countries • The U.S. has less income inequality than most developing nations, such as Brazil, but more inequality than many developed nations, such as Japan and Sweden. • Income is highly unequally distributed among countries. • The average per capita income in the richest countries in the world is approximately 100 times the average income in the poorest countries in the world.
The Distribution of Wealth • Wealth is the value of the things individuals own. • Income is payments received plus or minus changes in value of one’s assets in a specified time period. • Wealth is more unequally distributed in the U.S. than is income. • The bottom 40% of U.S. population has zero net wealth. • To be in the top 5% of the wealthy requires total wealth of at least $4 million.
Bottom fifth 0 Second fifth .2 Third fifth 4.5 Fourth fifth 11.7 Top fifth 83.6 Wealth Compared to Income in the U.S. 100 80 Percentage of total household wealth Wealth Quintile 60 Cumulative percentage of wealth/income 40 Family income 20 Household wealth 20 40 60 0 80 100 Cumulative percentage of families/households
Income Distribution According to Class • There seems to be a professional-nonprofessional class distinction arising in the U.S. • Substantial differences also exist between incomes of men and women and among ethnic groups. • There is some mobility among classes. • Class divisions are currently not determined solely by income.
The Class System as a Pyramid and as a Diamond Developing Country’s Class System U.S. Class System Upper class Upper class Middle class Middle class Lower class Lower class
Distributional Questions and Tensions in Society • Both radicals and conservatives describe the tensions among classes in society better than the mainstream, classless analysis. • Mainstream economists focus on the share distribution of income. • Radicals focus on class and group structures. • Conservatives emphasize the role of special interests in shaping government policy.
Philosophical Debates about Equality and Fairness • Some philosophers argue that inequality creates diversity that enriches the lives of everyone. • Others maintain that equality is the overriding goal. • The Declaration of Independence asserts that “all men are created equal.” • Objective economists limit themselves to explaining the effect of various policies on the distribution of income.
Fairness and Equality • Most Americans see fairness as equality of opportunity. • There are great differences of opinion as to what constitutes “equal opportunity.” • There are three problems in determining whether an equal income distribution is fair. • People do not start from equivalent positions. • People’s needs differ. • People’s efforts differ.
Important Side Effects of Redistributive Programs • Society may decide to redistribute income from rich to poor to meet its ideal of fairness. • There are three side effects of redistribution of income: • The labor to leisure incentive effect. • The tax avoidance or evasion incentive effect. • The incentive to appear more needy than you actually are.
Income Redistribution Policies • The government redistributes income through direct and indirect methods. • The indirect method involves the establishment and protection of property rights. • The direct methods include: • Taxation – policies that tax the rich more than the poor. • Expenditures – programs that help the poor more than the rich.
Taxation to Redistribute Income • The federal government gets most of its taxes from: • Personal income tax • Corporate income tax • Social Security tax • State and local governments get most of their tax from: • Income tax • Sales tax • Property tax
Taxation to Redistribute Income • Progressive - the average tax rate increases with income. • It redistributes income from the rich to the poor. • Proportional – the average tax rate is constant regardless of income. • It is neutral in regard to income redistribution. • Regressive – the average tax rate decreases as income increases. • It redistributes income from poor to rich.
Taxation to Redistribute Income • The federal income tax is progressive. • The Social Security tax is initially proportional up to a limit of $90,000, after which it is regressive. • State income taxes are somewhat progressive. • Sales taxes are slightly regressive. • Property taxes are roughly proportional.
Expenditure Programs to Redistribute Income • Social Security – a social insurance program that provides financial benefits to the elderly and disabled and to their eligible dependents and/or survivors. • Medicare – a medical insurance system for retired people. • Public assistance programs – means-tested social programs that provide financial, nutritional (Food Stamps), medical (Medicaid), and housing assistance.
Expenditure Programs • Supplemental Security Income (SSI) – a federal program that pays benefits, based on need, to the elderly, blind, and disabled. • Unemployment Compensation – short-term financial assistance, regardless of need, to eligible individuals who are temporarily out of work. • Housing programs – federal and state programs to improve housing or to provide affordable housing.
100 90 80 70 60 After taxes and transfers Cumulative percentage of income 50 40 30 20 10 0 10 20 30 40 50 60 70 80 90 100 Cumulative percentage of households Distribution of Income Before & After Taxes and Transfers, 2003 • After-transfer income is somewhat closer to being evenly distributed. • The increase in equality may come at the cost of a reduction in the total amount of income earned by society. Before taxes and transfers
Summary • The Lorenz curve is a measure of the distribution of income among families in a country. • The farther the Lorenz curve is from the diagonal, the more unequally income is distributed. • The official poverty measure is an absolute measure because it is based on the minimum food budget for a family. • It is a relative measure because it is adjusted for inflation.
Summary • Income is less equally distributed in the U.S. than in some industrialized countries, such as Sweden, but more equally distributed than in many developing countries, such as Brazil. • Wealth is distributed less equally than income. • Income differs substantially be class and by other socioeconomic factors, such as age, race, and gender. • Fairness is a philosophical question , so people must judge a program’s fairness for themselves.
Summary • Income is difficult to redistribute because of incentive effects of taxes, avoidance and evasion of taxes, and incentive effects of distribution programs. • The U.S. tax system is roughly proportional, so it is not a very effective means of redistributing income. • Government spending programs are more effective than taxes in reducing income inequality in the U.S.
Review Question 17-1 What is the official definition of poverty? Why is it both a relative and an absolute measure? A family is in poverty if its income is equal to or less than three times an average family’s minimum food expenditures. The definition is relative because it is adjusted for inflation. It is absolute because it is based on a fixed minimum food budget for a family. Review Question 17-2 What has happened to the distribution of income in the U.S. since 1970 and why? The distribution of income in the U.S. has become more unequal since 1970 because real wages did not keep up with inflation, taxes became less progressive, and government funding for many social programs was reduced.