Superresolution Chromatography
This study presents a novel nonparametric method for resolving overlapping peaks in chromatographic data, addressing limitations of traditional parametric methods such as Gaussian and Lorentzian approximations. Utilizing the RECOVERY software package, we analyze protein mixtures separated by gel filtration, showcasing enhanced peak resolution, particularly with bovine serum albumin (BSA) components. The proposed method significantly improves separation quality while being cost-effective—a fraction of the HPLC setup costs. Our findings indicate that nonparametric analysis can yield reliable and precise chromatographic results.

Superresolution Chromatography
E N D
Presentation Transcript
Superresolution Chromatography E.L.Kosarev - P.L.Kapitza Institute for Physical Problems, RAS http://www.kapitza.ras.ru/people/kosarev/home.htm K.O.Muranov - N.M.Emanuel Institute of Biochemical Physics, RAS http://kmuranov.euro.ru
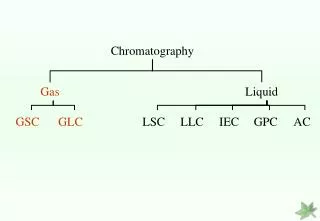
Chromatographic analysis Chromatography: • Adsorption/Partition • Affinity • Ion-exchange • Size-exclusion
Peaks’ overlapping problem • Peaks overlapped form the joint peak
Imperfects of parametric deconvolution • Supposition - Peak shape can be described analytically (Gaussian, Lorenz, etc.) • Parametric deconvolution needs: • peak position • peak wide • peak amplitude. • Unknown peak characteristic causes an error. For instance, two peaks were identified instead ofthree
Imperfects of parametric deconvolutionPeakbroadeningandcolumn voiding The main factors • Diffusion • Non-specific interaction • System overdampening (irreversible adsorption, filter contamination, plunger damage, etc.)
Problems: • the shape of a real chromatography peak could not be approximated exactly with any function • the parametric technique cannot give reliable results
We suppose: the problem of overlapping peaks’ separation could be accurately solved with the use of a nonparametric method
Nonparametric method • The peak's shape is determined directly from the separation of an individual compound and can be called the point spread function of a chromatographic column • If the shapes of these peaks are the same throughout the entire working range of the device, then chromatogram is a distribution convolution with the peak of this shape • the point spread function includes all factors influenced the separation
Nonparametric method • The decomposing a complex spectrum into the same components is achieved by solving an integral convolution equation • For this equation: • the input data is the chromatogram • the convolution operator kernel is the point spread function of the chromatograph column
Analysis of chromatography separation data with the RECOVERY software package Method • A protein mixture of known composition (bovine serum albumin monomer, dimer, and trimer) was separated by gel filtration for obtaining of heavily overlapping peaks. • The data was processed with the use of the RECOVERY software package • The result was compared with the finer separation data obtained with the use of the HPLC.
BSA chromatography and point spread function determination A - Elution profile of bovine serum albumin (BSA). • The blue arrow indicates unresolved peak • Red dashed lines mark the time interval when the BSA monomer fraction was collected B -Elution profile of the collected fraction • Absence of unresolved peak • Strongly pronounced a peak asymmetry
Recovering of the chromatographic separation data • A - the source BSA chromatogram; • B - point-spread function; • C - recovering result of the chromatographic separation data with the RECOVERY software package.
The RECOVERY result vs. HPLC separation A - data recovered with nonparametric approach B - Elution profile of HPLC separation (TSK G2000 SW Spherogel, 10mm X 600 mm, flowrate - 0.5ml/min) • Both Recovery software package and HPLC found the BSA monomer, dimer and trimer in protein mixture • Recovery shows the more precision result
Peak width and whole column limit- under investigation • Separation of the rat eye lens crystallins (magenta) • 10 kD - 1.5 MD limit • Peak width of the standard proteins (blue)
Conclusion: • the proposed method fundamentally improves the quality of the chromatographic separation • RECOVERY software package for the gel filtration data significantly increased the resolution of this method and exceeded the quality of the separation obtained with the HPLC technique • new possibilities are achieved through reasonable processing of the measured data with no complication in the instrumentation • cost of the used instrument complex for gel filtration ($1,000) is roughly 15-20 times lower than that for the HPLC setup ($20, 000).