Download
1 / 19
190 likes | 294 Vues
This overview delves into the integration of computer science skills with environmental science to address critical ecological issues. It covers data gathering through remote sensing, data visualization with GIS, and the management of environmental databases. Learn how to utilize these tools for effective environmental modeling and communication, and explore case studies on pollution management and climate change mitigation. Emphasizing the need for skills in GIS, this guide encourages students and professionals to engage in activism and collaborative efforts to protect our planet.

E N D
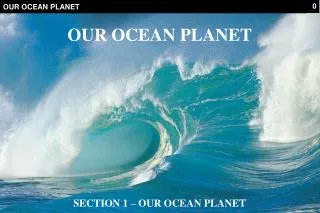
IT for the Planet:Computing Climate Stephanie B. Ohshita Dept. of Environmental Science, USF
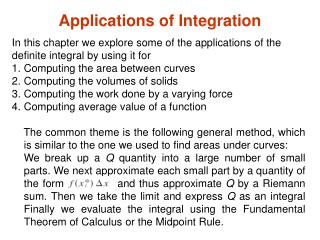
Overview: Using computer science skills for the environment • Data gathering: remote sensing from desert to ocean • Data visualization: seeing solutions with GIS • Environmental management with databases • Environmental modeling • “who done it?” • “what if . . . ?” • Environmental communication and activism on the web
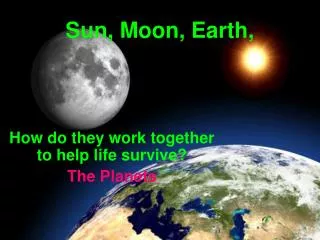
How to capture data from remote and harsh places like the desert in Xinjiang, western China?
Remote Sensing: non-intrusive data gathering that gives us the really big picture Images from: Ohio State University, National Science Olympiad.
Remote Sensing : Animal Factory - Feedlot Cows from Space[www.sprol.com]
Remote Sensing : Slash and Burn Agriculture in the Amazon[www.sprol.com]
Geographical Information System (GIS) • data stored as layers • common database operations (queries, statistical analysis) • plus the visualization of maps • powerful tool for explaining events and planning strategies
GIS: lava flows and vegetation With GIS, USF Prof. Tracy Benning has been examining how landscape variation affects ecosystem functioning on Hawaii.
ArcInfo ArcView AMLs Avenue Metadata MapInfo Vertical Mapper MapBasic Visual Basic Image Analyst (add-on for remote data sensing) GIS Software Packages Job Tip: The US Geological Service (USGS) is now looking for people with GIS skills to work in Hawaii . . .
Making the connection: relational databases for environmental management • Data is stored in a centralized, efficient and organized manner. • Data can be shared easily. • All those involved see a more complete picture of processes and problems. • By querying the data and combining with GIS, managers can see variations in the data, identify future monitoring needs, and develop pollution control solutions.
noise profile from a power plant chiller contour plot of contaminant concentrations mean summer rainfall (1986-2002) Environmental Modeling Images from: Navcon Engineering Network, GEMSS W2 Model, and Instituto di Biometeorologia.
“Who done it?” Using models to trace heavy metal contamination
We are marching across America for one year, via the internet, to bring everyone together in one loud clear voice of concern to urge our leaders to address global warming now. Please join the march and make your voice heard too.
Leonardo DiCaprio's Personal Impact Page Leonardo DiCaprio's impact on Stop Global Warming: 636 Friends 104 Friends-of-Friends 7 3rd Degree Friends 748 Total If you would like to join Leonardo DiCaprio, register as a friend>
With science skills, you can do a lot – even save the planet. Good luck in your studies!