The surface science approach
460 likes | 619 Vues
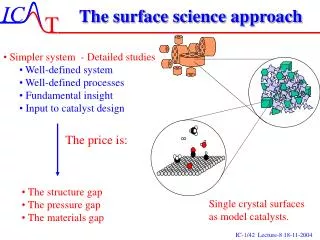
The surface science approach. Simpler system - Detailed studies Well-defined system Well-defined processes Fundamental insight Input to catalyst design. The price is:. The structure gap The pressure gap The materials gap. Single crystal surfaces as model catalysts.

The surface science approach
E N D
Presentation Transcript
The surface science approach • Simpler system - Detailed studies • Well-defined system • Well-defined processes • Fundamental insight • Input to catalyst design The price is: • The structure gap • The pressure gap • The materials gap Single crystal surfaces as model catalysts.
Determination of important parameters. We want to have setailed information on important parameters like: • Adsorption rates meaning: S(T)=S0e-Ea/RT • Reaction rates: k=k0e-Er/RT • Desorption rates: kdes=kdes0e-Edes/RT Construct a microkinetic model based on reliable fundamental data resulting in deep insigth.
1. Order Adsorption By equalizing the chemical potentials of the gas and thesurface and introducing the appropriate partition function we found We must now estimate S0(T) from experiments or calculations
1. Order Adsorption We remember that for desorption: Find KA from isostere: HOW? Langmuir isotherm for adsorption on a single site
2. Order Adsorption Desorption:
2. Order Adsorption However if B=A so it is A2:
Determination of sticking coefficients • Thermalized Experiments • The real data, but not always possible and they do not reveal details • Beam experiments • Are giving detalied information on the dependence of energy in • different degrees of freedom, but may not probe the correct • reaction pathway
1. order adsorption: S0=1/D0 D0
Uptake on Clean Ru(0001) Agreement with S0=(1±0.8)·10-12 at 300K in earlier work Dietrich, Geng, Jacobi, and Ertl, J. Chem. Phys.104 (1) (1996) 375
Molecule Surface Temperature (K) S0 Eact (kJ/mol) Some typical S0(T) H2 Cu(100) 250 5x10-13 48 D2 Cu(100) 250 2x10-13 56 CH4 Ni(111) 500 2x10⁻⁸ 74 CH4 Ni(100) 500 7x10⁻⁸ 59 CH4 Cu(100) 1000 8.6x10⁻⁹ 201 N2 Ru(001) 400 1x10⁻¹⁰ 38 N2 Au/Ru(001) 670 5x10-15 >130
Determination of desorption rates • The bonding energy of simple adsorbates to a specific surface • On-set temperatures of reaction or decomposition • Reaction pathways on the surface
The Complete Method Now collect a lot of TPD curves and read of as a function of T where qleft is the same. Then for each qleft we can plot Getting: As the intercept and the slope. This can be done for all qleft Giving n and Edes as function of coverage.
The simple method 2. order Notice symmetric and shifts down Thus by assuming q=1/2 can we again estimate Edes qleft=1/2
N2 desorption from Ru(0001) 0.05 ML Au on Ru(0001) Clean Ru(0001) Mass 14 QMS signal Mass 14 QMS signal • All thermal experiments with N2/Ru(0001) systems are dominated • by steps.
More complex behaviour CO TPD from Pt(112) A typical behaviour for a two state situation But a dublet can also be due to strong lateral interaction i.e. Erepulsion = Eo for q>1/2
TPD for identification of reaction pathways HCOO** ½ H2+CO2+2* CO2*+H* HCOO** Tells a lot about surface reactions Can be used for analysis
Example: The Ammonia synthesis N2 + 3H2 2NH3 Micro-kinetic Modeling The idea is to collect all the fundamental information I.e. any adsorption rates, desorption rates incl. prefactors and activation energies, sticking coefficients etc. and put them into a detailed model. If correct the model should then be capable of describing the process and identify what is important in the process, i.e. what is the rate limiting step, how can it be changed and what is the coverage of various species.
The Ammonia Synthesis We can now express each coverage in terms of K, k, pressure, and q*
The details of ammonia synthesis Notice how the molecular state is not in play since it is assume in equilibrium: qN2 cancels
The rate limiting step may not even have an barrier If we assume 0.030eV-2*0.025*5/3 = -0.05eV The important message is that although the activation is low there is still an entropy barrier
Comparison Theory & Experiment Measured data N2 Fe(111) Calculated N2 Fe(111) and Fe(100) Within the accuracy of DFT
Example: Nitrogen coverage Edes= 190kJ/mol and=1x10¹³s-1
Now back to the model Atomic nitrogen is MARI qN~1 K promoted ammonia catalyst at 673 K, 100 bar approaching 68% of the equilibrium ammonia concentration.
Approach towards Equilibrium The exit concentration is 19% and corresponds to 75% of the obtainable equilibrium conversion for 100 bar and 673K. The approach towards equilibrium is slow because N* blocks the surface
Comparrision of model and exp. This is not a proof but an indication that we are on the right track
Structural gap in the Ammonia Synthesis over Ru Catalysts 3/2H2 + 1/2N2 NH3DH0 =-46 kJ/mol Ru Why Ruthenium? Fe is blocked by N (NH3) Fe NH3 Conc. Ru is not as easily blocked by N (NH3), but by Hydrogen and it is expensive!! Fe Reactor length
Energy Diagram for N2 Dissociation Terrace site Step site Electronic effects account for one third of the barrier change Geometrical effects for two thirds of the barrier change S. Dahl, A. Logadottir, R. Egebjerg, J. Larsen, I. Chorkendorff, E. Tørnqvist, and J. K. Nørskov, Phys. Rev. Lett. 83 (1999) 1814. Energy
Microkinetic Model forAmmonia Synthesis over Ruthenium N2 + 2 * 2 N* H2 + 2 * 2 H* N* + H* NH* + * NH* + H* NH2* + * NH2* + H* NH3* + * NH3* NH3 + * k+ k- From assuming 1% of active sites on the clean Ru(0001) surface. k+1 = 105·exp(-37 kJ/mol / RT) (bar-1s-1) The rest of the parameters are in agreement with tailing edge of TPD spectra of N2, H2 and NH3 desorption from Ru(0001) S. Dahl, J. Sehested, J. H. Jacobsen, E. Tornqvist, and I. Chorkendorff, J. Catal. 192 (2000) 391.
Universality Fe(111) is good Ru steps are good You can now see why the catalyst bed should be varied down through the reactor
inlet inlet C The equilibrium curve A The optimum operating line D B outlet inlet The Industrial Ammonia synthesis The Real Ammonia reactor The schematic reactor
The equilibrium curve The optimum operating line The Industrial Ammonia synthesis
The Concept of Optimal catalyst curve 2:1 80bar 420oC 3:1 200bar 450oC 5% 5% Defines optimal Catalyst 90% 90% High ammonia conc. 90% requires low bonding energy 3:1 200bar 450oC 2:1 80bar 420oC Low ammonia conc. 5% requires higher bonding energy Claus Jacobsen et al. J. Catal. 205 (2002) 382
Promoters K K CH4 DETS = em =19 kJ/mol m = 0.2 eÅ Structural promotors: Al2O3 and CaO for the ammonia cat. helps stabilizing the structure ensuring a huge surface area Electronic promotors: K, Cs for the ammonia cat. Set up a dipole moment lowing the activation energy for either adsorption or desorption They may also act as inhibitors i.e. methane sticking on Ni
Inhibitors or poisons Poisons may as just seen work through an electronic effect Often poisons are species that just block sites, i.e. bond Strongly or irreversible to the active sites. Good examples are Sulfur, Chlorine, and Oxygen: 1 ppm H2O in the ammonia syn-gas reduces the activity by a factor of 2. Explain why one should not use leaded fuel on a modern car?