Download
1 / 40
400 likes | 528 Vues
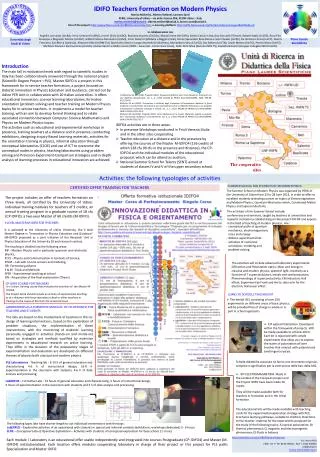
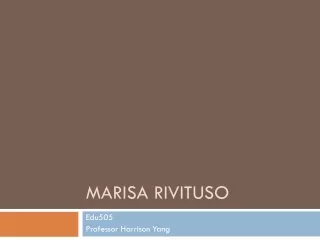
Sensors as extension of senses via USB: three case studies on thermal, optical and electrical phenomena. Mario Gervasio, Marisa Michelini, Rossana Viola Research Unit in Physics Education of the University of Udine, Italy. VALUE OF USING ON-LINE SENSORS IN DIDACTIC LABORATORY.

E N D
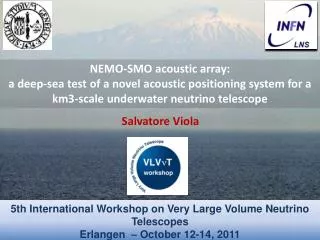
Sensors as extension of senses via USB: three case studies on thermal, optical and electrical phenomena Mario Gervasio, Marisa Michelini, Rossana Viola Research Unit in Physics Education of the University of Udine, Italy
VALUE OF USING ON-LINE SENSORS IN DIDACTIC LABORATORY Social, methodological-disciplinary and practical reasons lead to the using of computer in school laboratory: • Our everyday life is full of computerized objects and It is important, on social level, to prepare young students to this continue evolution, with information, adequate experiences, methodologies and critical instruments to understand and use such apparatuses. • In research laboratories computers manage data and are integral part of the investigation. So on-line experiments may allow students to understand contents and methods characterizing physics. • On practical level, on-line experiments offer efficiency, time-saving, reliability, precision, reproducibility of data, all with quite cheap instruments. Moreover they allow an immediate and direct contact with the phenomenon, advancing a laboratory open to the personal construction of ideas and new occasion of learning, thanks to the following potentialities:
VALUE OF USING ON-LINE SENSORS IN DIDACTIC LABORATORY POTENTIALITIES - Extension of the possibility of • observation of events too much quick or slow as regards manual measures 2. measures in rather inaccessible places 3. collecting data easily, favouring in this way the comparison of diagrams and graphs, the search of characteristics and initial conditions, various considerations about the analyzed system (e.g. energetic)
VALUE OF USING ON-LINE SENSORS IN DIDACTIC LABORATORY POTENTIALITIES 4. study of non linear processes, like the transitory in several types of phenomena, thanks to the quick data acquisition (not possible in traditional laboratory, where measures regards the variation of quantities in initial and final equilibrium states). This allows familiarity with experimental situations and theoretical closely examination based on experimental evidence These possibilities make the experimentation in school closer to the reality and, thus, more interesting and stimulating, so that phenomena may be analyzed in their completeness and interpretative models easily understood
VALUE OF USING ON-LINE SENSORS IN DIDACTIC LABORATORY POTENTIALITIES - Improving of quality of measures, in reliability and sensitivity, that allows both advanced and base experiments, these last in several deeper ways, to encounter the interests of students, so that the laboratory becomes culturally stimulating. - Time-saving (collecting quickly data on-line) and good reproducibility, that favour the conceptualization and the focusing of the attention on data, on planning and manual aspects (choose of the experiment and Its assembly), on physic problem, on the description of the characteristics of phenomena, on the comparison between different experimental situations. - Collecting a lot of data, that limits the introduction of hypothesis and allows the use of statistic methods
VALUE OF USING ON-LINE SENSORS IN DIDACTIC LABORATORY POTENTIALITIES - Attention to conceptual aspects of procedure of measurement: setting and calibration of the system, chose of measure interval, sensitivity, resolution, time of data acquisition. - Real time graphs of time depending (and not) phenomena, whose understanding (of role and meaning) may help in overcoming some cognitive problems (e.g. lacking in capability of execution and use of graphs) thanks to the following potentialities: • visual impact favours the analysis of the phenomenon 2. the possibility to follow, in real time, the evolution of the phenomenon and/or the characteristics of collected data stimulates the search of interpretations, common discussion, the comparison of ideas, analysis and selection of meaningful parts, the determination of questions and problems to test.
VALUE OF USING ON-LINE SENSORS IN DIDACTIC LABORATORY POTENTIALITIES 3. in explorative activities, in which student compares sensorial information with signals collected by the sensors, the graph favours the rationalization of sensations and the enucleation of interpretative hypothesis. 4. collecting several graphs for each event makes graph a familiar representative tool.
VALUE OF USING ON-LINE SENSORS IN DIDACTIC LABORATORY POTENTIALITIES - Developing of planning capability, comparison between data collected in different times and conditions, comparison between phenomena describable through similar formal relations. - Applications in system of control that allow to understand the concepts of feed-back, stability, not linearity, and to develop plans for automation.
VALUE OF USING ON-LINE SENSORS IN DIDACTIC LABORATORY POTENTIALITIES • - Possibility of integration with other software: • of calculus, for data processing, • of simulation, for the comparison with the theory, • of modelling, for a process of interpretation that starts from the hypothesis of the students. • The software is a set of tools for data processing, It has to be open, flexible, multifunctional and It represents a powerful tool to analyze conceptual meaning of data, to develop analytic though, investigative interest, intuition and theoretical though.
VALUE OF USING ON-LINE SENSORS IN DIDACTIC LABORATORY It is clear that on-line experimentation cannot and mustn’t be the only way to carry out a laboratory activity. But a correct management of the activity avoid a reduction of active participation of students and capability of analysis of the experiment. It may stimulate a deeper study of treated argument: in fact It often happens that the graphs given by computer suggest other graphs.
SENSORS AS PROPOSALS OF EXTENSION OF SENSES Thinking to the validity and opportunity of introducing the use of on-line measurements in didactic laboratories also at low level (12-16 years old), It emerges the need for systems easy to be carried out with cheap materials, directly connected to the computer via USB, so that requires brief time of setting up and few knowledge of electronics, for a good use and eventual modifications. In this prospective on-line measurements with sensors are thought as a first extension of senses in a laboratory that aims to a study of phenomena to reach a formalization based on an interpretative examination of experimental analysis.
SENSORS AS PROPOSALS OF EXTENSION OF SENSES A continue and active intervention of the user is required, both for the choice of the parts to use and for the way to use them. • Moreover several activities are possible: • common or in group phenomenological exploration, • experimentation to individuate relations between variables, • measure of physic quantities, • proof of theoretical hypothesis, • experimental examination of phenomena. The user has to plan the way to carry out the experiment too, so that planning and manipulative aspects, the analysis and the interpretation of data, are choices in an experimental activity in which each one may organize the construction of his knowledge.
SENSORS AS PROPOSALS OF EXTENSION OF SENSES The hardware is simply made of sensors, connected directly to the computer via USB. The software usually offers several options for each phase and the user may: - choose the procedure (e.g. setting up, calibration, measure, management of files) - assign few operations and parameters (e.g. sampling interval, number of sensors to use, variables and scale for real-time graphs). Here we present three examples of hw-sw systems on thermal, optical and electrical phenomena.
1. REAL-TIME TEMPERATURE VS TIME MEASUREMENT WITH TERMOCRONO Termocrono is a system based on on-line sensors to make four contemporary real-time measures of temperature that allows to follow thermodynamic processes. The connection to the computer is via USB. The system consists of an hardware and a software part.
REAL-TIME TEMPERATURE VS TIME MEASUREMENT WITH TERMOCRONO HARDWARE PART The hardware has a circuit for data acquisition and analogical-digital conversion. The temperature measure is based on the measure of inverse saturation current of germanium inversely polarized diodes. The conversion is of current-time type to utilize the precision of quartz oscillator of computer to do the measure. Circuit for signals acquisition and analogic-digital conversion of data acquired by Termocrono
REAL-TIME TEMPERATURE VS TIME MEASUREMENT WITH TERMOCRONO HARDWARE PART With the same supply of computer and though each diode a capacitor is charged, at ends of which a tension comparator is inserted, with predefined minimum and maximum values of intervention. A monostable vibrator generates a square wave, that starts when that minimum value is reviled, and ends when that maximum value is reviled. So the duration of the square wave depends on the time (t) of charge of each capacitor, that depends on dynamic resistance R of the diode (t=RC), that depends on the temperature of germanium diodes, in which the saturation inverse current is a constant strongly dependent by the temperature.
REAL-TIME TEMPERATURE VS TIME MEASUREMENT WITH TERMOCRONO HARDWARE PART The duration of square wave is measured, utilizing a quartz oscillator (16 MHz). With the frequency counting set off by the oscillator you reveal the number of impulse generated in the period of activation of the square wave, so that the temperature measure depends on the number of generated impulses. The utilized impulses meter is at 32 bit, with a time-out value at 22nd bit (4.194.303 counting): up that value the sensor is supposed bad working. An interface card, implemented with a microcontroller PIC 18F252 by Microchip Technology, is used to read in the same time the four counting of the four independent sensors. The counting are sent to the computer via USB connection, realized using a decoding module FT245BM.
REAL-TIME TEMPERATURE VS TIME MEASUREMENT WITH TERMOCRONO HARDWARE PART - The circuit is contained in a little box (cm 9 x cm 4 x cm 1,5). - The temperature diode-sensors are connected to four bipolar cables (2m) that are connected to the box through only one connector. - The four sensors may be used independently too.
REAL-TIME TEMPERATURE VS TIME MEASUREMENT WITH TERMOCRONO SOFTWARE PART It is possible to visualize at the same time the graph and the data of one or all the sensors. Graphic scale may be at dynamic or fixed optimization. The measure interval is [-10°C,+100°C], the sensibility is 0,1°C, the measure accuracy is 0,3 °C. Each group of sensors requires calibration before using. The calibration is stable for the same hardware group. The function “Real Time Plot” of the program activates the measure. User interface of the software of the system
REAL-TIME TEMPERATURE VS TIME MEASUREMENT WITH TERMOCRONO SOFTWARE PART Data acquisition consists of a measure per second and a real-time graph, that evolves in time, is carried out on the video. Graphs and tables may be saved in archives, so that they may be recalled for examination and/or printing. Recording format of tables of data is directly compatible with any calculus sheet. The system may be used with any computer via USB connection. User interface of the software of the system
REAL-TIME TEMPERATURE VS TIME MEASUREMENT WITH TERMOCRONO SOFTWARE PART
REAL-TIME TEMPERATURE VS TIME MEASUREMENT WITH TERMOCRONO EXAMPLES OF MEASURES Termocrono is proposed as extension of senses for experimental explorations at low school level, thanks to Its semplicity and flexibility. Thanks to the sensibility, accuracy and quick data acquisition, It allows experimental study of states of thermodynamic transformations. So It allows the study of transitory too, as impulses and thermal waves, possible with difficulty with other systems in didactic laboratories. Here some examples of measures are presented, relevant for different aspects, to understand the meaning of measure of temperature and the zero principle of thermodynamic.
REAL-TIME TEMPERATURE VS TIME MEASUREMENT WITH TERMOCRONO EXAMPLES OF MEASURES A) Two sensors are on a table; a student takes in his hands a sensor first, then both and at the end puts one sensor on the table again. This experience makes students aware that: - the table and the hands are two systems with different constant temperature - during the transitory the sensors measure their own temperature - only when sensor and system are in thermal equilibrium the given information about the temperature regards the system - the different length of the phases of warming and cooling of sensors is caused by the different efficiency of the systems during thermal interaction.
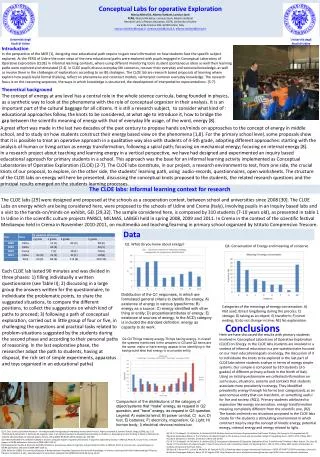
REAL-TIME TEMPERATURE VS TIME MEASUREMENT WITH TERMOCRONO EXAMPLES OF MEASURES B) In Fig. the evolution in time of the temperature of two masses of water (m1= 300 g at T1=10,2°C and m2= 150 g at T= 49,8 °C ) is shown. The system is so set: the box with the mass m2 is putted inside the other. The two systems evolves towards a common equilibrium temperature, according Fourier law of thermal equilibrium. Resulting equilibrium temperature is 24,1°C and allow the calculation the mass 11,9 g as equivalent in water of the box. (media pesata sulle masse della temperatura di ciascun sistema)
REAL-TIME TEMPERATURE VS TIME MEASUREMENT WITH TERMOCRONO EXAMPLES OF MEASURES C) The sensors are covered with sheets of different materials and are at home temperature on a table; a student takes sensors in his hands, waits thermal equilibrium, then put sensors on the table again. This experience makes students aware that the sensors reach the same temperature but in different time intervals, dependent on materials, and introduces the idea of thermal conductivity.
REAL-TIME TEMPERATURE VS TIME MEASUREMENT WITH TERMOCRONO EXAMPLES OF MEASURES D) Fig. shows data obtained when the four sensors are covered with different masses of aluminium (0, 2, 4 and 10g) and putted in a big mass of warmer water (isothermic). The dependence of the time to reach equilibrium on the mass of aluminium allows to understand the meaning of time of response of a system and to calculate It. It is possible to study the exponential low to reach equilibrium.
2. A SIMPLE SYSTEM FOR DIFFRACTION EXPERIMENTS: LUCEGRAFO HARDWARE PART Here are presented the hardware and the software characteristics of a simple home-made system for on-line data acquisition of light intensity according to Its position. The equipment is elementary: a commercial linear cursor potentiometer, a phototransistor, an assembly box, USB cable. The phototransistor is inserted in a housing made an aluminium block solid with the cursor of the potenziometer, so that the optic signal is correlated with the position by means of the resistance of the potentiometer. A small rectangular screen (12 cm x 2 cm), solid with to the optic sensor support, has the function of allowing overall qualitative observation of the distribution of light intensity.
2. A SIMPLE SYSTEM FOR DIFFRACTION EXPERIMENTS: LUCEGRAFO HARDWARE PART At the centre of the screen there is a hole (section area 1 mm^2) functioning as a diaphragm for the optic sensor. A screw guide for fine movements of the cursor is eventually available. Both the sensors (potentiometer and phototransistor) are connected to the processor via USB. The calibration of the system is made measuring the light intensity as a function of the distance from a point-like source. The experimental dependence of the light intensity on the square of distance is both a confirm of the current transfer function assumed and the way to find the unknown parameters.
A SIMPLE SYSTEM FOR DIFFRACTION EXPERIMENTS: LUCEGRAFO SOFTWARE PART There are 3 ranges of sensibility, to acquire the 12th maximum and the central maximum, at a distance of 2 m, with a single slit of 0,1 mm and a laser with λ~650Å. During the measure the system acquires and represents on the screen, both in graphical and numerical way, couples (I,x) (intensity, position), one per second, so that, moving linearly the cursor, the space distribution of light intensity for a length of 60 m is acquired. The measure is represented in linear response: the intensity, in the graph, is represented in arbitrary units, proportional to the light intensity incident the sensor.
A SIMPLE SYSTEM FOR DIFFRACTION EXPERIMENTS: LUCEGRAFO EXAMPLES OF MEASURES Here some examples of activities are presented, those impossible to carry out with traditional systems without sensors in didactic laboratories A) Exploration of light intensity distribution of a diffraction pattern : Qualitative inspection of the diffraction pattern on a screen, changing the distance D between the slit and the screen: the screen intercepts constant angular distribution of light intensity; in fact, the distances of minima and maxima from the central maximum increase proportionally to the distance D.
A SIMPLE SYSTEM FOR DIFFRACTION EXPERIMENTS: LUCEGRAFO EXAMPLES OF MEASURES The system cannot reveal in the same scale both the intensity of the central maximum and those of the nearby ones, unless the incident intensity is reduced. This give the opportunity for a discussion both of the characteristics of the diffraction pattern and those of optical sensors. Diffraction pattern with the system in the low range of sensibility Diffraction pattern with the system in the high range of sensibility.
A SIMPLE SYSTEM FOR DIFFRACTION EXPERIMENTS: LUCEGRAFO EXAMPLES OF MEASURES: B) Analysis of peak intensity
A SIMPLE SYSTEM FOR DIFFRACTION EXPERIMENTS: LUCEGRAFO EXAMPLES OF MEASURES: B) Analysis of peak intensity
A SIMPLE SYSTEM FOR DIFFRACTION EXPERIMENTS: LUCEGRAFO EXAMPLES OF MEASURES: B) Analysis of peak intensity The central maximum intensity can be calculated from the slope of the straight line through the origin, starting from the other involved parameters.
3. RESISTIVITY VS TEMPERATURE MEASUREMENT IN SUPERCONDUCTORS ELECTRONIC SOLUTION FOR THE MEASUREMENT <> The measurements are carried out in 4 points in line configuration, measuring he tension between two internal points with injected current of 100 mA. A constant fixed current value is obtained by producing a constant reference tension with a zener diode in a circuit where two operational amplifier are located to provide to the tension measurement on the sample (between the two internal point contacts) for he resistivity measure (milliohm). The problem of bias tension of the contacts is overcome, because the output reference tension can be fixed via hardware, minimizing the input current in the operational amplifier. The amplification rate ranges from 5 (open circuit) and 1000. the second amplifier guarantee measured values of the order of mV. The temperature measure is done by the platinum resistance PT100 (R=100 ohm at 0 °C) with resolution rate of 0,4 Ohm/°C. A 12 bit ADC converter is enough for the temperature measure in the working range, with resolution less of 0,1 °C:
RESISTIVITY VS TEMPERATURE MEASUREMENT IN SUPERCONDUCTORS THE DATA ACQUISITION AND THE SOFTWARE INTERFACE The measurement of temperature and resistivity are carried out by using two 12 bit ADC converter and a programmed multiplexer PIC 18F252 of Microchip Technology. Data are acquired via USB using a decoder module. The interface is very simple and familiar. Real time graphs are produced on the screen.
RESISTIVITY VS TEMPERATURE MEASUREMENT IN SUPERCONDUCTORS THE PROBE BOX A cylindrical Al box realized the thermalization area. The Cu code of the box is putted in liquid nitrogen. The heater is realized by two resistance of 100 Ohm (1 watt) are inserted in a parallel circuit on the base of the Al box. The increasing of the temperature is realized by acting via software on an analogic elipot connected with a power transistor given the requested current to the heater. The resistivity measurements are carried out in rampa . The temperature sensor is putted in contact with the sample in the Al box and connection wires are collected on the cover of a thermos containing the liquid nitrogen the measurement system
RESISTIVITY VS TEMPERATURE MEASUREMENT IN SUPERCONDUCTORS Data obtained in rampa heating at 0,02 °C/swith commercial sample
REFERENCES - M Michelini, /L'elaboratore nel laboratorio didattico di fisica: nuove opportunità perl'apprendimento, /Giornale di Fisica, XXXIII, /4, /1992, p.269- E. Mazzega, M.Michel in i, /Termograjb: un sistema per misure di temperatura on-line nel laboratorio didattico, /La Fisica nella Scuola, XXI[I, /4, /1990 p.38- D.Girardini, A. Sconza, E. Mazzega. M.Michelini, /Studio della conduzione del calore con l'utilizzo del computer on-line, /La Fisica nella Scuola, XXIV, 2, 1991, p.7I- E Mazzega, M Michelini, /On-line measurements ofthermal conduction in solids: an experiments for high school and undergraduate students. /u Teaching the Science of Condensed Matter and New Materials, GIREP-ICPE Book, Forum i 996- E Mazzega, M Michelini, /Termo grafo: a computer on-line acquisition system for physics education, /in Teaching the Science of Condensed Matter and New Materials, GIREP-ICPE Book, Forum 1996, p.239- Gervasio M, Michelini M, /TERMOCRONO. Un semplice sistema economico eflessibile per misure di temperatura in tempo reale, /in /Didamatica 2006--- /Atti, Andronico A, Aymerich F, Fenu G eds., AICA, Cagliari 2006, p.522-529- V.Mascellani,.E.Mazzega. M.Michelini. /Nuove opportunità di apprendimento in ottica mediante l'uso dell'elaboratore, /La Fisica nella Scuola, XXII, suppl.4, 4, 1989 p.4S- V.Mascellani, E.Mazzega, M.Miche!ini, /Un sistema per esperienze di ottica on-line e indicazioni per attività didattiche nello studio della dffiazione ottica, /La Fisica nella Scuola, XXV, i (Speciale congiunto AIF-SIF), 1992 p.l32- F Corni, V Mascellani, E Mazzega, M Michelini, G Ottaviani, /A simple on-line system employedin daction experiments, in Light and Information, /Girep book, L C Pereira, J A Ferreira, H A Lopes Editors, Univ. do Minho, Braga 1993- A Frisina, M Michelini, /Physical optics with on-line measurements oflight intensity, /in Teaching the Science of Condensed Matter and New Materials, GIREP-ICPE Book, Forum 1996, p.I62