Download
1 / 13
130 likes | 212 Vues
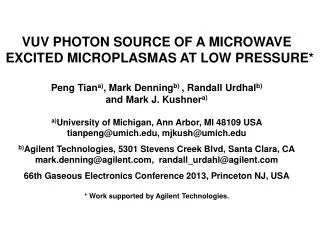
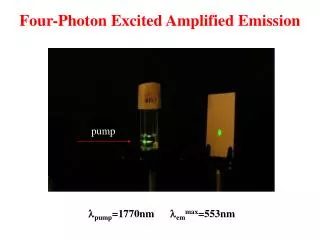
Four-Photon Excited Amplified Emission. pump. l pump =1770nm l em max =553nm. Quantum Dots for bioimaging. Compared to organic fluorophores, the major advantages offered by quantum dots for bioimaging are:

E N D
Four-Photon Excited Amplified Emission pump lpump=1770nm lemmax=553nm
Quantum Dots for bioimaging • Compared to organic fluorophores, the major advantages offered by quantum dots for bioimaging are: • Quantum dot emissions are considerably narrower compared to organic fluorophores, which exhibit broad emissions. Thus, the complication in simultaneous quantitative multi-channel detection posed by cross talks between different detection channels, derived from spectral overlap, is significantly reduced. • The lifetime of emission is longer (hundreds of nanoseconds) compared to that of organic fluorophores, thus allowing one to utilize time-gated detection to suppress autofluorescence, which has a considerably shorter lifetime. • The quantum dots do not readily photobleach. • They are not subject to microbial attack.
(A) Size- and material-dependent emission spectra of several surfactant-coated semiconductor nanocrystals in a variety of sizes. The blue series represents different sizes of CdSe nanocrystals with diameters of 2.1, 2.4, 3.1, 3.6 and 4.6 nm (from right to left). The green series is of InP nanocrystals with diameters of 3.0, 3.5, and 4.6nm. The red series is of InAs nanocrystals with diameters of 2.8, 3.6, 4.6 and 6.0nm. (B) A true-color image of a series of silica-coated core (CdSe)-shell (ZnS or CdS) nanocrystal probes in aqueous buffer, all illuminated simultaneously with a handheld ultraviolet lamp
Schematics of a ZnS-capped CdSe quantum dot covalently coupled to a protein by mercaptoacetic acid
Various up-conversion processes exhibited by rare-earth ions
Cellular Imaging Bioimaging using up-converting nanoparticles on oral epithelial carcinoma cells (KB). KB cells were incubated with nanoparticles consisting of Er-doped Y2O3 nanophosphors in silica shell. Plate A represents the light transmission image of the KB cells. Plate B is the fluorescent emission after excitation with 974nm. Plate C is the composite of Plates A and B.
Cellular Mechanism of Chemotherapy The structure of Chemotherapeutic drug-carrier (LH-RH peptide)-dye conjugate. TPLSM images of MCF-7 cells showing the intake of drug into cell over a time period of 50 minutes.
Imaging of Cell Division Right panel shows two-photon excited imaging of KB cell with DNA (green pseudo color) and RNA (red pseudo color) staining with Acridine Orange. Left panel shows the fluorescence spectra obtained, using localized spectroscopy, from different locations in the cell.
Normal Pouch Malignant Pouch Two-Photon Imaging of Soft, Tumor Tissue Ex vivo imaging of extracted tumor tissue from a hamster cheek pouch showing the selective accumulation of drug-dye conjugate in tumor (two-photon imaging using 800nm excitation). In this pseudocolored image, blue is the transmission signal while red shows two-photon fluorescence signal.
Two-Photon Imaging of Hard Tissue, Dental Imaging 3D reconstruction of dentinal tubule images obtained using TPLSM. Extracted tooth was treated with dye doped dental bonding agent and imaged using a confocal microscope with an 800nm excitation from a Ti:Sapphire laser.
OCT Imaging of Hard Tissue, Dental Imaging Optical Coherence Tomography Image of Cross Section of Human Tooth
In-Vivo Retinal Imaging This indocyanine green angiogram of the same patient shows the deeper choroidal vessels. The leaky vessels (choroidal neovascularization) are shown well here.