TOR-8
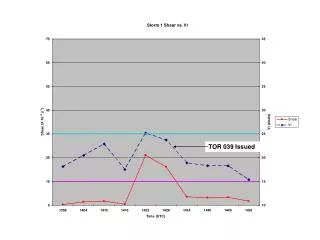
Annual Cycle. Comparison of daily ozone maximum [ppb] for the „remote“ station Eifel Coarse (125 km) and nest1 (25 km). Ozone over Europe 1997. Annual Average [μg/m3]. Maximum Concentration [ μg/m 3 ]. Base Case. ozone.


TOR-8
E N D
Presentation Transcript
Annual Cycle Comparison of daily ozone maximum [ppb] for the „remote“ station Eifel Coarse (125 km) and nest1 (25 km) Ozone over Europe 1997 Annual Average [μg/m3] Maximum Concentration [μg/m3] Base Case ozone Comparison of daily ozone maximum [ppb] nest1 results with all TEMES ozone sites (33) NO2 Emission Scenario „1987“ Model scores coarse and nest1 according the EU directives Evaluation Ozone NO2 Hourly Data Difference:Scenario –Base Case Daily Averages Emission Scenario „1987“ (according TOR2 model initiative) Anthr. NOx: +43 % , anthr. NMVOC: +67 %, CO + 67% Daily Maxima Comparison of EURAD simulations with measurements from TEMES network in North Rhine-Westphalia (Germany). Results from the coarse grid (125 km) and nest1 (25 km) TOR-8 A One-Year Simulation of Photochemistry over Europe with a Complex Chemistry Transport ModelContribution to subproject GLOREAM and TOR2H. Feldmann, M. Memmesheimer, E. Friese, H. J. Jakobs, A. Ebel, M.J. Kerschgens Address: University of Cologne, Cologne, Germanye-mail: hf@eurad.uni-koeln.de • Aims • To calculate the concentrations of air pollutants according the EU-directives 96/62 and 99/30 • Regional focus: North Rhine-Westphalia (NRW), Europe • Reference year: 1997 • chemical components: NO2, NOx, CO, SO2, benzene, ozone and PM10 (Friese et al; Poster: AER-07) • The data sets of this study are also suited for the objectives of EUROTRAC2 and especially TOR2.: • Contribution to the TOR2 model initiative (Roemer et al.) • Seasonal dependence of air pollution concentrations over Europe • Regional dependence of air chemistry • Emission scenario (defined by the TOR2 model initiative) to estimate the effect of the emission changes in the last decade on the air pollution situation over Europe • Conclusions • A complex 3 dimensional chemistry-transport model has been improved: The EURAD model is now able to treat long-term simulations (including aerosol dynamics and chemistry) • The model results have been evaluated against monitoring data:The model performance shows interesting seasonal features: • The ozone concentrations are underestimated in spring – especially for clean and moderately polluted situations. This indicates a discrepancy in the European background concentrations during spring • NO2 is underestimated during summer. Possible explanations are: The measurement uncertainties at low concentrations; the still to coarse resolution of nest1 (traffic related stations are included in the comparison) • The RACM mechanism tends to underestimate peak ozone concentrations – above 180 g/m3 - in NRW. Sensitivity studies show that the biogenic components play an important role for the underestimation. • The “1987/1997” emission scenario shows major regional differences for the effect on ozone: For northern Europe the annual average is unchanged or slightly increasing with the reduced emissions. In southern Europe emission reduction and ozone change are positive correlated. • The emission reduction strongly reduces the ozone peak concentrations for the major conurbations over Europe. • The simulation results are suitable for AOT40 analysis • References • Hass, H., P.J.H. Builtjes, D. Simpson, R. Stern, 1997: Comparison of model results obtained with several European regional air quality models. Atmos. Environm., 31, 3259 - 3279. • Memmesheimer, M., M. Roemer, A. Ebel, 1997: Budget calculations for ozone and its precursors: seasonal and episodic features based on model simulations. J. Atmos. Chem., 28, 283 - 317. • Stockwell, W.R., F. Kirchner, M. Kuhn, S. Seefeld, 1997: A new mechanism for regional atmospheric chemistry modeling. J. Geophys. Res., 102, 25847-25879. • Jakobs, H.J., S. Tilmes, A. Heidegger, K. Nester, G. Smiatek, 2001: Short-term ozone forecasting with a network model system during summer 1999. J. Atmos. Chem., in press. • Kessler, Ch., W. Brücher, M. Memmesheimer, M.J. Kerschgens, A. Ebel, 2001: Simulation of air pollution with nested models in North Rhine-Westphalia. Atmos. Environm., 35, S3-S12. • Schell, B., I.J. Ackermann, H. Hass, F.S. Binkowski, A. Ebel, 2001: Modeling the formation of secondary organic aerosol within a comprehensive air quality modeling system. J. Geophys. Res., in press. Acknowledgements EURAD is financially supported by the BMBF within the Atmospheric Research programme (AFO2000). Long-term applications with respect to EU directives have been supported by the Environmental agency of North-Rhine-Westphalia (LUA). Emission data have been provided by EMEP and TNO/UBA. The landuse data have been provided by IFU, Garmisch-Partenkirchen. Access to meteorological data (ECMWF) have been given by the meteorological department of the IGM, University of Cologne. The measurements are provided by the Environmental agency of North Rhine-Westphalia. Numerical calculations have been supported by the RRZK, University of Cologne and the Research Center Juelich (ZAM, NIC, ICG-II). We gratefully acknowledge the very helpfull discussions with the colleagues from the Environmental Agency of North-Rhine-Westphalia (LUA), the German Environmental Agency (UBA), the EUROTRAC community (in particular GLOREAM and TOR), the Ford Research Center and the ICG-II of the Research Center Juelich. Model Design for Long-term applications of EURAD - Mother Domain (CG): Europe, grid size 125 km - Nest 1: Central Europe, grid size 25 km - Nest 2: North Rhine-Westphalia, grid size 5 km - Nest 3 (only episodes) selected areas in NRW, grid size 1 km - Vertical resolution: 23 layers up to 100 hPa - Lowest layer thickness: 40 m - 15 layers below 3000 m Meteorological model: MM5 Emissions: Europe: EMEP (gases), TNO (Particels) - NRW: LUA-NRW Chemical mechanism: RACM (Stockwell et al., 1997) with ros2-solver (Kessler et al., 2001) Aerosols: Dynamics MADE Secondary organic aerosols: SORGAM (Schell et al., 2001) Status: CG, Nest1 completed, Nest2 running