Understanding Climate Change: Key Issues and Temperature Measurement Techniques
This report delves into the complexities of climate change, focusing on the increase in atmospheric CO2 levels and the methods used to collect and compile global temperature data. It evaluates the effectiveness of temperature as a climate change metric and highlights the challenges posed by seasonal variations, data collection inconsistencies, and different measurement techniques. Additionally, it discusses solar cycles, ocean acidification, and the implications of climate models, including positive and negative feedback mechanisms in response to increased CO2.


Understanding Climate Change: Key Issues and Temperature Measurement Techniques
E N D
Presentation Transcript
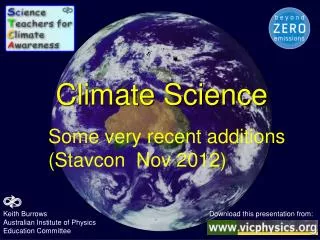
Climate Science Some Food For Thought
IPCC 2001 • Mann et. al. 1999
A Critical Look At “Global Temperature” • How is Temperature Data Collected? • Tree Rings • Corals • Ice Core • Satellite • Thermometers/Thermistors • How is temperature compiled into a Global Average? • GISS—NASA Goddard Institute for Space Science • HadCRUT • NCDC-NOAA National Climatic Data Center
Is global temperature the best measure of climate change? • Other issues to think about: • Different seasons • Dial Cycles • Monitoring of temperature is not uniform across the globe • Monitoring is not uniform across time • Different methods to measure temperature • Was the earth in a state of energy balance to begin with?
Sunspots and Solar Cycles • Temporary phenomenon • Area of intense magnetic • inhibits convection • Reduces surface temperature • Appears as a dark spot • Occurs on 11 year cycle and relates to solar radiation • Area around sunspots are bright and increase average solar radiance • Increase solar radiation with increased number of sun spots
Solar Magnetic Cycle Fig. 1 Moving 11-year average terrestrial temperatures (Northern Hemisphere) shown as deviations in C from the 1951–1970 mean value (left vertical axis and thick line) and the solar magnetic cycle lengths (right vertical axis and thin line) (modified after Robinson et al. 1998, Fig. 3)
Climate Models Gary Strand at the National Center for Atmospheric Research (NCAR). This particular image shows sea surface temperatures, near-surface winds, and sea ice concentrations in one of the NCAR models at some point during a run of the model on a supercomputer.
How will the earth respond to CO2 warming? • Posative Feedback • Increases in water vapor • Decreased cloud cover • Negative Feedback
Limitations To Climate Models • Sensitivity of Data Collection • Carbon dioxide to the atmosphere by burning fossil fuels is estimated to have caused an imbalance of about 1.5 Watts per sq. meter between the 235 to 240 Watts—Not within a measurable range • Complex Systems/ Poorly Understood Systems • Cloud cover and formation, precipitation • All of the IPCC climate models reduce low- and middle-altitude cloud cover with warming, a positive feedback. This is the main reason for the differences in warming produced by different climate models.
IPCC Report Erros • Melting of the Himalayan glaciers • ERROR: 80% of Himalayan glacier area would likely be gone by 2035 • Sea Level in Netherlands • ERROR: “The Netherlands is an example of a country highly susceptible to both sea-level rise and river flooding because 55% of its territory is below sea level.” • Netherlands Environmental Assessment Agency: “55 per cent of the Netherlands is at risk of flooding; 26 per cent of the country is below sea level and 29 per cent is susceptible to river flooding.”
Ocean Acidification— The Other CO2 Problem Henry’s Law: Px=k*[X]
“the acidity of the oceans will more than double in the next 40 years. This rate is 100 times faster than any changes in ocean acidity in the last 20 million years, making it unlikely that marine life can somehow adapt to the changes.” -- Thomas Lovejoy, biodiversity advisor to the World Bank, Dec. 2009
Works Cited • http://solar-center.stanford.edu/sun-on-earth/glob-warm.html • http://www.giss.nasa.gov/research/news/19990408/ • http://www.economist.com/node/16479264 • http://news.bbc.co.uk/2/hi/science/nature/7933589.stm • http://images.google.com/imgres?imgurl=http://www.uigi.com/Temperature_swings_11000_yrs.jpg • http://upload.wikimedia.org/wikipedia/commons/7/7c/Atmospheric_Transmission.png • http://www.esrl.noaa.gov/gmd/ccgg/about/co2_measurements.html • http://www.esrl.noaa.gov/gmd/ccgg/about/co2_measurements.html • http://www.giss.nasa.gov/research/news/19990408/ • http://geosci.uchicago.edu/~rtp1/BardPapers/Bard06EPSL.pdf • E. Bard and M. Frank. “Climate change and solar variability: What's new under the sun?” Earth and Planetary Science Letters 248 (2006) 1–14 • Climate Models: An Assessment of Strengths and Limitations. Executive Summary. The U.S. Climate Change Science Program. Pg. 1-6 • R. W. Spencer. “How Do Climate Models Work?” July 13th, 2009 • http://data.giss.nasa.gov/gistemp/ • http://www.whoi.edu/OCB-OA/page.do?pid=40276