Download
1 / 22
220 likes | 342 Vues
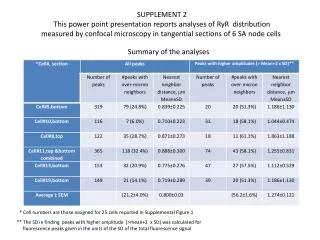
SUPPLEMENT 2 This power point presentation reports analyses of RyR distribution measured by confocal microscopy in tangential sections of 6 SA node cells. Summary of the analyses. * Cell numbers are those assigned for 25 cells reported in Supplemental Figure 1.

E N D
SUPPLEMENT 2 This power point presentation reports analyses of RyR distribution measured by confocal microscopy in tangential sections of 6 SA node cells Summary of the analyses * Cell numbers are those assigned for 25 cells reported in Supplemental Figure 1 ** The SD in finding peaks with higher amplitude (>mean+2 x SD) was calculated for fluorescence peaks given in the units of the SD of the total fluorescence signal
cell#5_bottom original 5* 20 mm
cell#5_bottom Intensity peaks of RyR labeling identified by “SD-slicing” computer algorithm (color dots). Peak amplitudes are coded by a rainbow-color scheme -0.6 0 0.6 1.2 1.8 2.4 3.0 3.6 4 4.6 5.2 5.8 Units are SD of total cell signal Mean of total cell signal
cell#5_bottom Results All peaks Peaks with higher amplitudes (> mean + 2 x SD) Nearest neighbor distance Nearest neighbor distance # of peaks # of peaks mm mm Peak amplitude Peak amplitude # of peaks # of peaks SD SD
cell#10 bottom original 10* 20 mm
cell#10 bottom_part2 Intensity peaks of RyR labeling identified by “SD-slicing” computer algorithm (color dots). Peak amplitudes are coded by a rainbow-color scheme -0.6 0 0.6 1.2 1.8 2.4 3.0 3.6 4 4.6 5.2 5.8 Units are SD of total cell signal Mean of total cell signal
cell#10 bottom_part2 Results All peaks Peaks with higher amplitudes (> mean + 2 x SD) Nearest neighbor distance Nearest neighbor distance # of peaks # of peaks mm mm Peak amplitude Peak amplitude # of peaks # of peaks SD SD
cell#8_top original 8* 20 mm
cell#8_top Intensity peaks of RyR labeling identified by “SD-slicing” computer algorithm (color dots). Peak amplitudes are coded by a rainbow-color scheme -0.6 0 0.6 1.2 1.8 2.4 3.0 3.6 4 4.6 5.2 5.8 Units are SD of total cell signal Mean of total cell signal
cell#8_top Results All peaks Peaks with higher amplitudes (> mean + 2 x SD) Nearest neighbor distance Nearest neighbor distance # of peaks # of peaks mm mm Peak amplitude Peak amplitude # of peaks # of peaks SD SD
cell#11_bottom (main text Fig.8) original 11* 20 mm
cell#11_bottom (main text Fig.8) Intensity peaks of RyR labeling identified by “SD-slicing” computer algorithm (color dots). Peak amplitudes are coded by a rainbow-color scheme -0.6 0 0.6 1.2 1.8 2.4 3.0 3.6 4 4.6 5.2 5.8 Units are SD of total cell signal Mean of total cell signal
cell#11_bottom (main text Fig.8) Results All peaks Peaks with higher amplitudes (> mean + 2 x SD) Nearest neighbor distance Nearest neighbor distance # of peaks mm mm Peak amplitude Peak amplitude # of peaks SD SD
cell#11_top original 11* 20 mm
cell#11_top Intensity peaks of RyR labeling identified by “SD-slicing” computer algorithm (color dots). original Peak amplitudes are coded by a rainbow-color scheme -0.6 0 0.6 1.2 1.8 2.4 3.0 3.6 4 4.6 5.2 5.8 Units are SD of total cell signal Mean of total cell signal
cell#11_top Results All peaks Peaks with higher amplitudes (> mean + 2 x SD) Nearest neighbor distance Nearest neighbor distance # of peaks # of peaks mm mm Peak amplitude Peak amplitude # of peaks # of peaks SD SD
cell#13_bottom original 13* 20 mm
cell#13_bottom Intensity peaks of RyR labeling identified by “SD-slicing” computer algorithm (color dots). Peak amplitudes are coded by a rainbow-color scheme -0.6 0 0.6 1.2 1.8 2.4 3.0 3.6 4 4.6 5.2 5.8 Units are SD of total cell signal Mean of total cell signal
cell#13_bottom Results All peaks Peaks with higher amplitudes (> mean + 2 x SD) Nearest neighbor distance Nearest neighbor distance # of peaks # of peaks mm mm Peak amplitude Peak amplitude # of peaks # of peaks SD SD
original cell#19_bottom 19* 20 mm
cell#19_bottom Intensity peaks of RyR labeling identified by “SD-slicing” computer algorithm (color dots). Peak amplitudes are coded by a rainbow-color scheme -0.6 0 0.6 1.2 1.8 2.4 3.0 3.6 4 4.6 5.2 5.8 Units are SD of total cell signal Mean of total cell signal
cell#19_bottom Results All peaks Peaks with higher amplitudes (> mean + 2 x SD) Nearest neighbor distance Nearest neighbor distance # of peaks # of peaks mm mm Peak amplitude Peak amplitude # of peaks # of peaks SD SD