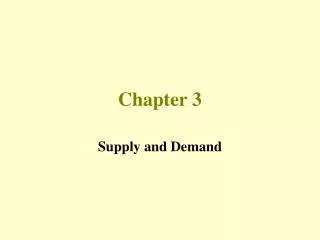
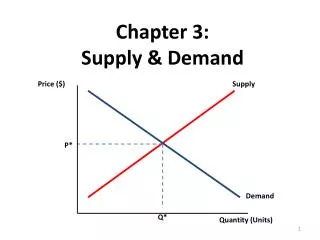
Chapter 3: Supply & Demand
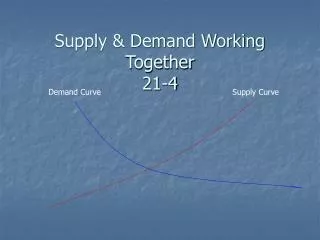
Chapter 3: Supply & Demand. Price ($). Supply. P*. Demand. Q*. Quantity (Units). Value, Prices, & Markets. Prices communicate information about the value of a good or service. Prices arise from the interaction of supply and demand in a market economy.

Chapter 3: Supply & Demand
E N D
Presentation Transcript
Chapter 3: Supply & Demand Price ($) Supply P* Demand Q* Quantity (Units)
Value, Prices, & Markets • Prices communicate information about the value of a good or service. • Prices arise from the interaction of supply and demand in a market economy. • Supply and Demand, and thus prices, coordinate the production and distribution of goods and services in the economy.
Competitive Markets • Definition: A competitive market is a market in which there are many buyers and sellers of the same good or service. • A completely competitive market is one where no one individual or firm can make a noticeable impact on the price. • Think about monopoly or oligopoly.
Supply & Demand • Supply & Demand: A simple model that describes how competitive markets work, and how prices are determined. • The Elements of the Model: • Supply and Demand Curves • What Factors Cause the Curves to Shift • Equilibrium Price and Changes in Equilibrium
Other Things Equal • When analyzing the relationship between the price and quantity demanded other variables must be kept constant. • Ceteris paribus(“all else equal”)
The Demand Schedule • The Demand Schedule is a Table which shows how much consumers will want to buy at each price.
The Demand Curve • The Demand Curve is a Graph of the Demand Schedule which shows how much consumers will want to buy at each price.
The LAW of DEMAND • The Law of Demand says that a higher price for a good, other things constant, means people will demand a smaller quantity of the good.
Individual vs. Market Demand For each price level sum the “individual quantity demanded” to get the “market quantity demanded” at that price level.
Individual vs. Market Demand For each price level sum the “individual quantity demanded” to get the “market quantity demanded” at that price level.
“Demand” vs. “Quantity Demanded” • When we talk about “Demand” we are talking about the ENTIRE DEMAND schedule or curve. • When we talk about “Quantity Demanded” we are talking about a SPECIFIC POINT on the demand curve – the quantity on the demand curve at SPECIFIC PRICE.
“Movement Along” vs. “Shift” A movement along the demand curve is a change in the quantity demanded of a good that is the result of a change in that good’s price. • from point A to point B: increase in quantity demanded reflects a movement along the demand curve • it is the result of a fall in the price of the good. • from point A to point C: increase in quantity demanded reflects a shift of the demand curve • It is the result of an increase in the quantity demanded at any given price.
Shifts in Demand • A change in quantity demanded at any given price represents a shift in the demand curve. Price • A decrease in demand means a leftward shift of the demand curve. • an “increase in demand”, means a rightward shift of the demand Decrease Increase D1 D2 D3 Quantity
Change in Prices of Other Goods • Substitutes: Two goods are substitutes if a fall in the price of one of the goods makes consumers less willing to buy the other good. Ex.: muffins and donuts. • Complements: Two goods are complements if a fall in the price of one good makes people more willing to buy the other good. Ex: PB&J, Computers/Monitors
Changes in Income • Normal Goods: When a rise in income increases the demand for a good—the normal case—we say that the good is a normalgood. • Inferior Goods: When a rise in income decreases the demand for a good, it is an inferior good. Ex: instant noodles.
Changes in Tastes or Expectations • Tastes & Preferences are constantly changing with Fads, Fashions, Needs and Wants.Can you think of any examples? • Expectations: Consumers choose not only which products to buy but also when to buy them.
Shifts in Demand • Suppose Tom Brady announces retirement and that the next game is his last game! What happens at the next game?
Check Understanding Question A What would be the effect of a sharp increase in the price of squash balls on the demand for squash racquets? Why? If the price of a compliment good rises, then demand decreases for the good in question and the demand curve shifts left. Price Decrease D1 D2 Quantity
Check Understanding Question B What would be the effect of a sharp increase in the price of Pepsi on the demand for Coke? Why? If the price of a substitutegood rises, then demand increases for the good in question and the demand curve shifts right. Price Increase D1 D2 Quantity
Check Understanding Question C As Larissa’s income goes up, she buys less instant noodles. What kind of a good is instant noodles for Larissa? Goods for which demand decreases if your income rises are called inferior goods. In this case, instant noodles are an inferior good. Price Decrease D1 D2 Quantity
Check Understanding Question D Following David Beckham and Sting, more men start to follow the fashion of wearing skirts. What would the effect of this change in tastes be on the demand for skirts? Price If tastes change in favor of a certain good, then demand increases for the good. Increase D1 D2 Quantity
Supply • Producers or Firms must make a decision about how much of a good or service to sell in the market place. • Quantity Supplied: The actual amount of a good or service that people are willing to sell at some specific price.
The Supply Schedule • The Supply Schedule is a Table which shows how much of good or service will be supplied at different prices.
The Supply Curve • The Supply Curve is a Graph of the Supply Schedule which shows how much sellers will want to sell at each price.
Law of supply holding everything else constant, increases in price cause increases in the quantity supplied, and decreases in price cause decreases in the quantity supplied.
“Supply” vs. “Quantity Supplied” • When we talk about “Supply” we are talking about the ENTIRE SUPPLY schedule or curve. • When we talk about “Quantity Supplied” we are talking about a SPECIFIC POINT on the supply curve – the quantity on the supply curve at a SPECIFIC PRICE.
“Movement Along” vs. “Shift” A movement along the supply curve is a change in the quantity supplied of a good that is the result of a change in that good’s price. • from point A to point B: decrease in quantity supplied reflects a movement along the supply curve • it is the result of a fall in the price of the good. • from point A to point C: decrease in quantity supplied reflects a shift of the supply curve • It is the result of an decrease in the quantity supplied at any given price.
Shifts in Supply • A change in quantity suppliedat any given price represents a shift in the supply curve. S1 S3 S2 Price • A decrease in supply means a leftward shift of the supply curve. • an “increase in supply”, means a rightward shift of the supply curve. Decrease Increase Quantity
Change in Input Prices • Why might input prices matter? • If the price of inputs rises, your costs go up, therefore you want to supply fewer goods at each price – supply decreases (shifts left) • If the price of inputs falls, your costs go down, therefore you are willing to supply more goods at each price – supply increases (shifts right)
Changes in Technology • A change in technology doesn’t necessarily mean just changes in electronics. Changes in technology can simply be changes in how things are done. • If a change in technology improves the production of a good (higher productivity or efficiency) then costs fall. • Producers are willing to supply more at every price – supply increases (shifts right)
Changes in Expectations • Expectations: Producer expectations about future events such as changes in costs or prices can cause supply to shift. • If you believe the price of your good will be higher in the future, you supply less today, thus supply decreases. • If you believe the price of your good will be lower in the future, you supply more today, thus supply increases.
Shifts in Supply (for scalpers) • Suppose Brady announces retirement and that the next game is his last game! Supply shifts left since scalpers have a harder time getting tickets.
Check Understanding Question A More homeowners put their houses up for sale during a real estate boom that has caused house prices to rise. Is this a shift or movement along…? S1 Price A change in prices results in a movement along the curve Quantity
Check Understanding Question B Strawberry farmers open temporary roadside stands during harvest season even though prices are usually lower at that time. S1 S2 Farmer’s have much more supply during harvest season. They need to sell them before they go bad. Increased supply reduces the prices. Price Increase Quantity
Supply, Demand and Equilibrium Competitive Market Equilibrium: when the quantity demanded of a good equals the quantity supplied of that good. The price at which this takes place is the equilibrium price (a.k.a market-clearing price) Every buyer finds a seller and vice versa The quantity of the good bought and sold at that price is the equilibrium quantity.
Equilibrium for Football Tickets Equilibrium Quantity = 8,000 Tickets Equilibrium Price = $250
Why does the market price fall if it is above the equilibrium price? • Let’s say the market price of $350 is above the equilibrium price of $250 • This creates a surplus • This surplus will push the price down until it reaches the equilibrium price of $250.
Surplus There is a surplus of a good when the quantity supplied exceeds the quantity demanded. Surpluses occur when the price is above its equilibrium level.
Why does the market price rise if it is below the equilibrium price? • Let’s say the market price of $150 is below the equilibrium price of $250. • This creates a shortage. • This shortage will push the price up until it reaches the equilibrium price of $250.
Shortage There is a shortage of a good when the quantity demanded exceeds the quantity supplied. Shortages occur when the price is below its equilibrium level.
Markets are never in equilibrium but they always tend to the equilibrium • Demand and Supply both matter because neither consumers or firms dictate equilibrium price. • Firm cannot sell anything at any price unless it can find a willing buyer. • A consumer cannot buy anything at any price without finding a willing seller.
What happens when the demand curve shifts? Coffee and tea are substitutes: if the price of tea rises (falls), the demand for coffee will increase (decrease). But how does the price of tea affect themarketfor coffee? E1: The original equilibrium in the market for coffee is at E1, at the intersection of the supply curve S and the original demand curve D1. E2: A rise in the price of tea, a substitute, shifts the demand curve rightward to its new position at D2. A shortage exists at the original price P1, so price rises and the quantity supplied increases, a movement along the supply curve. A new equilibrium is reached at E2, with a higher equilibrium price P2 and a higher equilibrium quantity Q2. When demand for a good increases, the equilibrium price and the equilibrium quantity of the good both rise. Shortage
What happens when the supply curve shifts? Technological innovation: Engineers learned how to put microscopic electronic components onto a silicon chip; allowing ever more components to be put on each chip. Surplus E1: The original equilibrium in the market for silicon chips is at E1, at the intersection of the demand curve D and the original supply curve S1. The shift: After a technological change increases the supply of silicon chips, the supply curve shifts right to its new position at S2. A surplus exists at the original price P1, so price falls and the quantity demanded increases, a movement along the demand curve. E2: A new equilibrium is reached at E2, with a lower equilibrium price P2 and a higher equilibrium quantity Q2. When supply of a good increases, the equilibrium price of the good falls and the equilibrium quantity rises.
Simultaneous Shifts in Supply and Demand What happens when the both supply and demand curves shift simultaneously? There is a simultaneous rightward shift of the demand curve and leftward shift of the supply curve. The increase in demand is relatively larger than the decrease in supply, so the equilibrium price rises and the equilibrium quantity increases.
Simultaneous Shifts in Supply and Demand Another Scenario There is a simultaneous rightward shift of the demand curve and leftward shift of the supply curve. The decrease in supply is relatively larger than the increase in demand, so the equilibrium price rises and the equilibrium quantity decreases.
The Effect of Demand and Supply Shifts on Equilibrium How Shifts in Demand and Supply Affect Equilibrium Price (P) and Quantity (Q)