Download
1 / 19
190 likes | 344 Vues
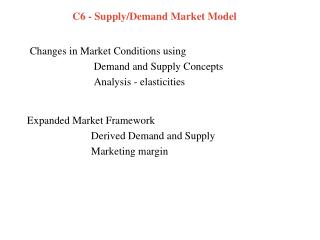
Supply & Demand Working Together 21-4. Demand Curve. Supply Curve. Supply and Demand at Work. What is a market? Any place or mechanism where g/s are exchanged between buyers & sellers The forces of supply and demand work together in markets to set prices . The Price Adjustment Process.

E N D
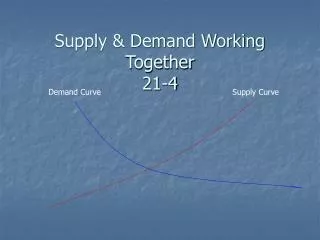
Supply & Demand Working Together21-4 Demand Curve Supply Curve
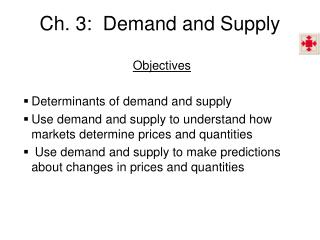
Supply and Demand at Work • What is a market? • Any place or mechanism where g/s are exchanged between buyers & sellers • The forces of supply and demand work together in markets to set prices.
The Price Adjustment Process • Why are supply & demand curves combined? • To see how they work together to set prices • Remember, in a market economy like ours, prices rise & fall according to what the consumer is willing to pay. This is VERY different in a command economy where the GOVT. determines ALL prices! • What color is the demand curve? blue • What color is the supply curve? red • When you see these curves on the test, they WILL NOT be in color!
Surplus: Too much of a product • At $40, suppliers will put 225 video games on the shelf, but consumers will only buy 150 at that price. • How many are left over that won’t get sold? 75 • (225-150=75) • What is a surplus? • Anytime you have extra products that didn’t get sold • When the # of units supplied (by the producer) is higher than the quantity demanded (by the consumer) • What does a surplus signal? • The price is too high • As a result, what will the seller do? • Lower the price
Shortage: selling out of a product • At $20, suppliers will put 105 video games on the shelf, but consumers want to buy 230 at that price (b/c that’s a good price!). • How many more video games are needed to meet the consumers’ demands? 125 • (230-105= 125) • What is a shortage? • When the # of units demanded (by the consumer) is higher than the quantity supplied (by the producer) • What does a shortage signal? • The price is too low. • As a result, what will the seller do? • Raise the price • This usually doesn’t happen immediately, though. Customers would be very upset to have the pay a higher price for the SAME product that ran out.
Market Forces • What is the equilibrium price? • The perfect PRICE where there is no surplus & no shortage! • In other words, supply = demand • Using the graph on p.589, the equilibrium price is $30. • At this price, there is neither a shortage or a surplus (because consumers will demand the same number of video games that producers are willing to supply). • Therefore the two quantities are EQUAL equilibrium price! • It’s where the two curves intersect!
Price ControlsEven though we don’t live in a command economy where the govt. sets prices, the govt. does interfere with prices ONLY to protect the consumer. • Why might the government set the price for a product? • Some prices are unfair, so the govt. will step in to make sure consumers aren’t being taken advantage of. • What is a price ceiling? • When the govt. sets a maximum price for a g/s • price “ceiling” = maximum (get it??) • Example: • Rent for an apartment (the govt. might say that a one bedroom apt. can not be rented for more than $800…again, this protects the consumer! ) • What is a price floor? • When the govt. sets a minimum price for a g/s • price “floor” = minimum (get it??) • Example: • Wages that a worker gets paid (the govt. creates a “minimum wage” law that says that each worker must be paid at least that amount…this protects the worker! ) Price Ceiling maximum Price Floor
Now, go back to the combined supply curve & demand curve that we drew together yesterday.
You learned 3 vocab. words from this worksheet that you need to add to YOUR graph. All of these will be shown on the curves: • Equilibrium Price • Surplus • Shortage
Equilibrium PriceThe price at which quantity demanded = quantity supplied Demand Curve Supply Curve Price
Surplus:goods left over Demand Curve Supply Curve Notice: It’s above the EQP. Surplus
Shortage: goods sold out! Demand Curve Supply Curve Shortage Notice: It’s below the EQP
Now, let’s see how all of these can be seen on the schedules: • Equilibrium Price • Surplus • Shortage
Looking at a schedule. Notice: It’s located above the EQP. Surplus Will have leftovers Will have leftovers Equilibrium Price b/c quantities are equal Won’t have enough Shortage Notice: It’s located below the EQP. Won’t have enough Won’t have enough
Now, can you do it by yourself? • Can you point to • the demand curve? • the supply curve? • The equilibrium price? • the surplus? • the shortage? • Do you need to hit the backspace button to review first?
A. Point to the demand curveB. Point to the supply curve.C. Point to the equilibrium price.D. Point to the surplus.E. Point to the shortage. Demand Curve Supply Curve surplus EqP shortage
a. What is the equilibrium price? • b. Where is the surplus? • c. Where is the shortage? Try this: Call Ms. Meadows over when you think you have all 3 answers!
And this: A. Point to the demand curveB. Point to the supply curve.C. Point to the equilibrium price.D. Point to the surplus.E. Point to the shortage.