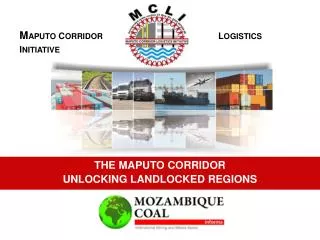
THE MAPUTO CORRIDOR UNLOCKING LANDLOCKED REGIONS
1.04k likes | 1.44k Vues
M APUTO C ORRIDOR L OGISTICS I NITIATIVE. THE MAPUTO CORRIDOR UNLOCKING LANDLOCKED REGIONS. The African Global Trade Picture The Maputo Transport Corridor The Maputo Corridor Logistics Initiative

THE MAPUTO CORRIDOR UNLOCKING LANDLOCKED REGIONS
E N D
Presentation Transcript
MAPUTO CORRIDOR LOGISTICS INITIATIVE THE MAPUTO CORRIDOR UNLOCKING LANDLOCKED REGIONS
The African Global Trade Picture • The Maputo Transport Corridor • The Maputo Corridor Logistics Initiative • Infrastructure Investments on the Maputo Corridor OUTLINE OF THE PRESENTATION
Logistics costs in Africa are the highest in the world • Building infrastructure to link countries and removing trade barriers between countries will reduce costs • Soft infrastructure is often lacking - a significant barrier to trade • Institutional and legal frameworks need to be in place to allow the development of regional projects • WEF Press Release THE AFRICAN GLOBAL TRADE PICTURE
The governments of the WORLD can no longer provide the necessary infrastructure unaided. There HAVE to be Public Private Partnerships. Source: OECD • World Bank determined African backlogs are: • 50% energy; • 25% transport; • 15% ICT; • 10% water and sanitation. • Success in developing projects in Africa lies in best harnessing the benefits of both public and private sectors in developing its resources • Peter Copley PrEng THE AFRICAN GLOBAL TRADE PICTURE
Costs of transport in Southern Africa • Some are surprised to learn that transport costs in South Africa are approximately equal to the World’s average transport costs • But once crossing borders come into the question, costs go up by a factor of between 4 and 8 (Source: Dr Gael Raballand’s doctoral thesis under the auspices of the World Bank) • Why? Because we don’t think as a region. • Peter Copley PrEng THE AFRICAN GLOBAL TRADE PICTURE
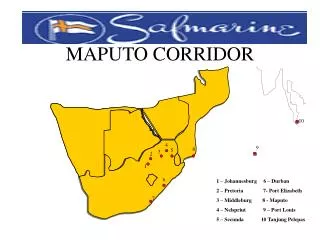
Road – 581kms Rail – 590kms THE MAPUTO TRANSPORT CORRIDOR
A Transport Corridor where Freight Logistics is creating an enabling environment for trade and investment, and is a catalyst for regional integration and cooperation MAPUTO TRANSPORT CORRIDOR
A economic corridor linking the economic hub of South Africa to the Port of Maputo • Launched as a tri-lateral initiative between South Africa, Mozambique and Swaziland in the 1990’s • The initiative has seen massive investment (>$5Bn) in transport infrastructure and projects over the last decade – road rail, ports, communication • There has also been significant economic investment • Socio-economic impact has been independently evaluated and demonstrated to be significant • The initiative therefore has been and continues to be considered one of the more successful corridor development programmes in the region MAPUTO TRANSPORT CORRIDOR
The Maputo Transport Corridor consists of 4 key nodes: • Road • Rail • Border Post • Port and Terminals MAPUTO TRANSPORT CORRIDOR
In 2003 – The transport corridor was still constrained by 5 Major Constraints • Lack of safe rail line and much needed rail capacity and service • Border post – limited commercial cargo clearing hours, -policies ; processes and procedures and lack of understanding for need of OSBP • Lack of container shipping lines calling port of Maputo • Overall lack of promotion of PPP on Transport corridor, knowledge and information of future port development and potential of transport corridor capacity • Lack of a Corridor Institutional Framework MAPUTO TRANSPORT CORRIDOR
The Institutional Framework on the Maputo Corridor • MCLI was established as a non profit company, established with the objective of revitalising the transport route and the removal of bottlenecks and constraints to trade • multi-lateral, multi-stakeholder membership organisation with a 130 members from SA, Mozambique, Swaziland • It operates within the framework of SADC, NEPAD and AU transport corridor development policy and has its emphasis on the promotion of cross border trade and investment and regional integration MAPUTO CORRIDOR LOGISTICS INITIATIVE
MCLI’s Role • Integrate - Participation in key National and Regional bodies and forums • Coordinate and Communicate - disseminate information and research on the Maputo Corridor • Facilitate - Act as a platform for engagement / interface between the public and private sector stakeholders to resolve constraints • Promote - the Maputo Corridor and market the strategic benefits and opportunities of the Corridor MAPUTO CORRIDOR LOGISTICS INITIATIVE
MCLI’s Role • Resolving the Constraints: • The interface between the public and private sector and to address issues jointly • Facilitate, Coordinate, Integrate, Communicate • Utilize the Working Group mechanism to engage stakeholders and resolve operational issues • Leverage the arsenal of top level relationships within government and the private sector to ensure maximum benefit for corridor users MAPUTO CORRIDOR LOGISTICS INITIATIVE
Transport Corridors provide industry with global access to markets. • The MAPUTO CORRIDOR is a true transportation corridor linking South Africa, Swaziland and southern Mozambique by 4 key elements: • Road • Rail • Border Posts • Ports & Terminals • The Maputo Corridor opens up South African industries to access export markets to Africa and the Far East IMPORTANCE OF TRANSPORT CORRIDORS
January to December 2012 - total trade between SA and Mozambique totalled R29,7 billion • Main import commodities – fuel, fruit, steel tubes and pipes • Main export commodities – coal, ferrochrome, magnetite, sugar, steel, maize • 1.146 million people • 730 000 vehicles (2011) • 87 000 trucks (2011) • SARS THE TRADE FIGURES
Road – 581kms Rail – 590kms Re-established proven transportation route for regional trade to international markets for SA, Zimbabwe, Swaziland, Botswana through Mozambique. THE MAPUTO CORRIDOR
Maputo is a key node in providing access to regional commodities • Key markets are India and China • Port Maputo Compliments South African Ports in accommodating regional demand in a multi-purpose port THE STRATEGIC LOCATION OF PORT MAPUTO
ROAD N4/EN4 HIGHWAY TOLL ROAD INFRASTRUCTURE ON THE MAPUTO CORRIDOR
ROAD INFRASTRUCTURE: • Traffic volume increases by 7% per annum • Heavy vehicle traffic is growing at an average of 10-11% per annum • Traffic between Matola and Maputo has increased way ahead of original projection – on a peak day Maputo Plaza averages 50-55 thousand vehicles per day INFRASTRUCTURE ON THE MAPUTO CORRIDOR
RAIL – Rehabilitation of the Ressano Garcia/Maputo Railway Line 92kms rehabilitation completed end 2008 Good cooperation between TFR, SR, CFM INFRASTRUCTURE ON THE MAPUTO CORRIDOR
RAIL INFRASTRUCTURE: • In the last 2-4 years CFM invested USD20 million on the rehabilitation of the RG Line. • Over the next 3 years CFM will invest between USD200-240 million on upgrading and modernization of the line, which includes duplication, electrification, increase bridges capacity, signalling and telecommunications. • CFM Ports & Railways INFRASTRUCTURE ON THE MAPUTO CORRIDOR
RAIL INFRASTRUCTURE: • 2012 Capacity: • 48 trains per week on the RG Line • RG Line was 4.71MTPA • 2013 Capacity: • 52 trains per week on the RG Line • 2013: Rail Traffic on RG Line 8.1MTPA • Wagons/train: • Magnetite: 60 wagons x 60 net/tons • Coal: 50 wagons x 58 net/tons • Others: 40 wagons x 40 net/tons • CFM Ports & Railways INFRASTRUCTURE ON THE MAPUTO CORRIDOR
Operations on the Goba Route to Maputo: • Distance: 226kms • Max Speed Allowed: 60km/h for SR and 50km/h for CFM • Length of Trains: 40 wagons for vacuum trains and 50 wagons for airbrake trains. • Utilization of the Goba Route: • Sugar • Iron Ore • Sugar and Iron Ore are only utilising 50% of the available capacity on the Goba Route • Swaziland Railway INFRASTRUCTURE ON THE MAPUTO CORRIDOR
RAIL INFRASTRUCTURE: • R17billion to be invested by TFR and SwaziRail for the 146km “SwaziLink” railway line to Maputo. • This line will create an additional 15MTPA to the Waterberg and Eskom Road to Rail Migration Programme • Transnet Freight Rail “SwaziLink” Press Release INFRASTRUCTURE ON THE MAPUTO CORRIDOR
With the volumes of rail friendly cargo currently being moved on road set to increase the lack of rail capacity is still one of the major constraining factors on our corridor LEBOMBO / RESSANO GARCIA BORDER POSTS
12 hour operation • Severe Congestion • Substantial delays • Inefficiencies • Added logistics costs
Agreement between the Governments of Mozambique and South Africa on a One Stop Border Control Post on the Mozambique-South African Border on 17 September 2007 – Target completion was May 2010. • The initial budget after design and costing (R1.9 billion) far exceeded available funding and is not possible under current economic climate. • November 2009 – Above agreement only ratified by Mozambique Government and still waiting on ratification by SA Government. • June 2012 – SARS Commissioner presents the OSBP case to the Standing Committee on Finance in the South African Parliament • Still not implemented despite the massive trajectory in growth • Still a continuous struggle to have the private sector included in planning process and to be continuously involved in a stakeholder engagement process and regular communication LEBOMBO / RESSANO GARCIA BORDER POSTS
The Impact of the Delay: • The economic impact of the delay in the Ratification of the Bilateral Agreement is far reaching: • dry port infrastructure development investors cannot effectively plan and implement • service providers such as clearing and forwarding agents, transporters, etc are restricted in development • Port investment affected • Port volumes affected • Growth of transit cargo affected • BOTTOM LINE = HIGHER COST OF DOING BUSINESS LEBOMBO / RESSANO GARCIA BORDER POSTS
BORDER POST: • Freight bypass road opened 11 June 2010 • Pedestrian facility opened March 2013 • With the new infrastructure that has been pumped into the border post we no longer have cargo, passengers and pedestrians moving through the same little border post INFRASTRUCTURE ON THE MAPUTO CORRIDOR
FREIGHT BYPASS ROAD OPENED JUNE 2010 CLEARING KM4 PEDESTRIAN FACILITY OPENED FULLY OPERATIONAL Cars, tourist, passengers 18 hour operation 24 hours at peak periods Ressano Garcia Freight, cargo Pedestrians Pedestrians Freight, cargo Lebombo Cars, tourist, passengers
Lebombo/Ressano Garcia Border Post • 1998– 29 000 tons through border post - • 2007 – 2.25million tons • In the 2 years between 2005 and 2007 • 43% increase in passengers • 73% increase in cars and busses • 65% increase in the total number of vehicles that crossed the border • 1,1 million passengers in Dec 2007 alone • Design capacity maximum 8000 per day
BORDER POST: • Between 600 and 800 bulk trucks per day through LRG • Clearing time between 4 and 8 mins due to the improved SARS Customs Modernisation System. Some C&F agents have it down to between 2 and 3 mins • Alfandega recently introduced the new SeW system at km4, we have been experiencing delays and congestion during peak time most importantly due to the reduced clearance times at km4 not corresponding to that of SA. • Teething delays are also experienced due to a new system and people having to get used to the new system and new processes. INFRASTRUCTURE ON THE MAPUTO CORRIDOR
The Impact of the Delay at km4: • The economic impact of the delay from the reduced operational hours at km4: • $500/day per truck = 300+ Jobs to be lost • Knock-on effect: • Port volumes affected, cargo does not reach ships in time • Multi-Million Rand contracts are breached • service providers such as clearing and forwarding agents & transporters have massive loss in revenue which cannot be recovered • Economical viability of the corridor is lost • BOTTOM LINE: • Jobs will be LOST • Loss of revenue to the RSA and MOZ economies LEBOMBO / RESSANO GARCIA BORDER POSTS
Priority Changes: • Prompt ratification of bi-lateral agreement by SA cabinet to ensure the co-hosting arrangements are “legalised” and project can continue. • Immediate decongestion of the Border Post by extending operational hours on a continuous basis to 24 hours per day and not only over festive periods • Immediate joint processing of commercial freight vehicles by both countries customs and immigration to ensure trucks do not stop inside congested frontier area. • Extension of clearing times at km4 to those of South Africa which will help with the reduction of delays at km4 • Joint Pedestrian Facility with access from both Mozambique and South Africa outside the current port area to be managed properly LEBOMBO / RESSANO GARCIA BORDER POSTS