Explanatory notes:
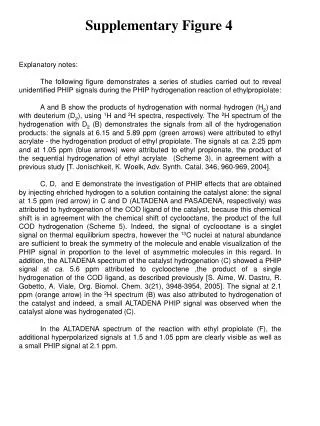
Supplementary Figure 4. Explanatory notes: The following figure demonstrates a series of studies carried out to reveal unidentified PHIP signals during the PHIP hydrogenation reaction of ethylpropiolate :

Explanatory notes:
E N D
Presentation Transcript
Supplementary Figure 4 Explanatory notes: The following figure demonstrates a series of studies carried out to reveal unidentified PHIP signals during the PHIP hydrogenation reaction of ethylpropiolate: A and B show the products of hydrogenation with normal hydrogen (H2)and with deuterium (D2), using 1H and 2H spectra, respectively. The 2H spectrum of the hydrogenation with D2 (B) demonstrates the signals from all of the hydrogenation products: the signals at 6.15 and 5.89 ppm (green arrows) were attributed to ethyl acrylate - the hydrogenation product of ethyl propiolate. The signals at ca. 2.25 ppm and at 1.05 ppm (blue arrows) were attributed to ethyl propionate, the product of the sequential hydrogenation of ethyl acrylate (Scheme 3), in agreement with a previous study [T. Jonischkeit, K. Woelk, Adv. Synth. Catal. 346, 960-969, 2004]. C, D, and E demonstrate the investigation of PHIP effects that are obtained by injecting ehriched hydrogen to a solution containing the catalyst alone: the signal at 1.5 ppm (red arrow) in C and D (ALTADENA and PASADENA, respectively) was attributed to hydrogenation of the COD ligand of the catalyst, because this chemical shift is in agreement with the chemical shift of cyclooctane, the product of the full COD hydrogenation (Scheme 5). Indeed, the signal of cyclooctane is a singlet signal on thermal equilibrium spectra, however the 13C nuclei at natural abundance are sufficient to break the symmetry of the molecule and enable visualization of the PHIP signal in proportion to the level of asymmetric molecules in this regard. In addition, the ALTADENA spectrum of the catalyst hydrogenation (C) showed a PHIP signal at ca. 5.6 ppm attributed to cyclooctene ,the product of a single hydrogenation of the COD ligand, as described previously [S. Aime, W. Dastru, R. Gobetto, A. Viale, Org. Biomol. Chem. 3(21), 3948-3954, 2005]. The signal at 2.1 ppm (orange arrow) in the 2H spectrum (B) was also attributed to hydrogenation of the catalyst and indeed, a small ALTADENA PHIP signal was observed when the catalyst alone was hydrogenated (C). In the ALTADENA spectrum of the reaction with ethyl propiolate (F), the additional hyperpolarized signals at 1.5 and 1.05 ppm are clearly visible as well as a small PHIP signal at 2.1 ppm.
Supplementary Figure 4 c c c s s s A * EA Products 1H m B 2H C Catalyst 1H D E F PHIP 1H G Reference 1H ppm 9 5 • Investigation of additional PHIP signals in the hydrogenation reaction of ethyl propiolate. • - 1H spectrum of the hydrogenation product ethyl acrylate, after 10 injections of 5 ml H2 each. The spectrum was recorded using 128 transients at high receiver gain to optimally detect the small product signals. *- Acetone signal, m-water in acetone, s - substrate (ethyl propiolate), c - catalyst, EA – ethyl acrylate (green arrows). • - 2H spectrum of the hydrogenation products after 22 injections of 5 ml D2, recorded using 128 transients. Blue arrows - ethyl propionate, orange arrow - hydrogenated product of the catalyst, red arrow - cyclooctane. • - 1H spectrum , ALTADENA study on the catalyst (cod)(dppb)Rh(I). • - 1H spectrum , PASADENA study on the catalyst (cod)(dppb)Rh(I). • - 1H reference spectrum, the catalyst in acetone prior to p-H2 injections. • - 1H ALTADENA spectrum enlarged to demonstrate the hyperpolarized signal of the catalyst and further reduction of ethyl acrylate to ethyl propionate. • -Reference 1H spectrum, ethyl propiolate and catalyst in acetone prior to p-H2 injections.