Understanding P-V Graphs in Thermodynamics: Key Concepts and Calculations
Learn how P-V graphs can convey important information about gas behavior, work done, and thermodynamic processes. Exploring isobaric, isovolumetric, isothermal, and adiabatic changes. Calculus involved. Gas expansion and contraction calculations included.

Understanding P-V Graphs in Thermodynamics: Key Concepts and Calculations
E N D
Presentation Transcript
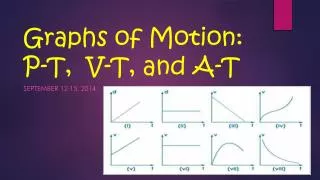
Graph • Area can tell important information P V
Work • P=F/A • V=A*x • P*V (area) = F/A * A*x = F*x = W • Careful with units! • Gas expand, Wby (gas) • Gas contract, Won (gas) • Wby= - Won
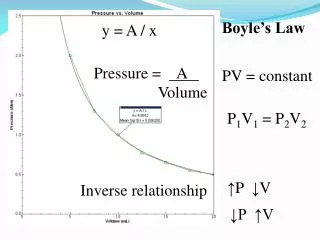
Isothermal • Same temperature • Area = nRTln (Vb/Va) • Requires calculus • P = nRT/V (inverse) • P-V graph P V
Isobaric • Same pressure • Area = P*DV • P-V graph P V
Isovolumetric • Same (constant) volume • Area = 0 • P-V graph P V
Adiabatic • No heat (Q) added • Area = W = DU • P-V graph P V
First Law of Thermodynamics • DU=Q+Won • Combine with kinetic theory (U=3/2nRT) • Combine with P-V information (isobaric, isovolumetric, isothermal, adiabatic)