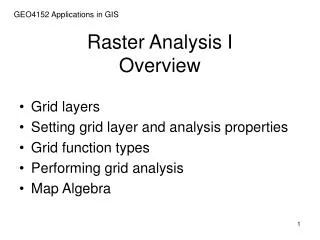
Raster Analysis
Raster Analysis. Topography: Slope, aspect, contours Raster Math Statistics: min, max, mean, std. dev. Distance Density Interpolation Classification Raster / Vector Conversions. Digital Elevation Model (DEM). Contours. Contours. 2200m. 2100m. 2000m. 1900m. DEM Cross Section.

Raster Analysis
E N D
Presentation Transcript
Raster Analysis Topography: Slope, aspect, contours Raster Math Statistics: min, max, mean, std. dev. Distance Density Interpolation Classification Raster / Vector Conversions
Contours 2200m 2100m 2000m 1900m DEM Cross Section
Calculating Slope DEM Cross Section
Slope Calculation • Fits a plane through 3x3 pixels around the pixel of interest • What effect does this have on the uncertainty of the resulting raster?
Aspect – Direction of the slope Aspect (Direction) Slope Rise Angle Run Slope = (Rise/Run) * 100%
Raster Math • A matrix of pixels Columns Rows
Analysis Environment • Spatial Reference (Coordinate System) • Make them the same • Extent • Area of interest • All rasters should overlap • Cell Size • Largest of all rasters or larger
Toolbox → Spatial Analysis Tools → Map Algebra → Raster Calculator Raster Calculator
Raster Math • Raster Math ≠ Vector or Linear Algebra 1 + 12 = 13 = +
Common Functions • Local: • Arithmatic: +,-,/, *, • MOD (Modulo): returns the remainder • Boolean: • OR: If either input is true, output is true • AND: If both inputs are true, output is true • CON (Conditional)
Mathematical Functions • Abs (absolute): flips negatives to positive • Ceil (ceiling): float to integer next highest integer value (i.e. 1.1 -> 2) • Floor: float to integer giving next lowest integer value (i.e. 1.1 -> 1) • Int (integer): truncates float to integer
Comparisons • <> (Not Equals) • == (Equals) • < (Less than) • <= (Less than or equal to) • > (Greater than) • >= (Greater than or equal to)
Raster Math: Comparisons 1 > 2 = 0 = >
Raster Math: Boolean AND 0 AND 1 = 0 = AND “AND” works but the calculator will insert “&”
Raster Math: Boolean OR 0 OR 1 = 1 = OR “OR” works but the calculator will insert “!”
Conditional Operator • Con(<condition>,<true>,<false>) • Given a raster “condition”: • Puts the true value where true and false value where false Con!
Elevations over 3000 meters • Con("W100N40.DEM“>3000,0,1)