Raster Analysis Techniques for Effective Spatial Data Management
Explore raster analysis tools for topography, statistics, and conversions. Learn local, neighborhood, and zonal statistics methods. Discover Jim's secrets for raster processing and data management tips.

Raster Analysis Techniques for Effective Spatial Data Management
E N D
Presentation Transcript
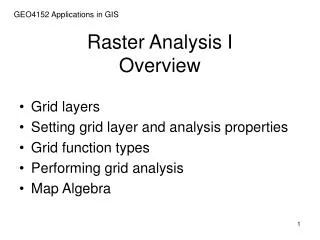
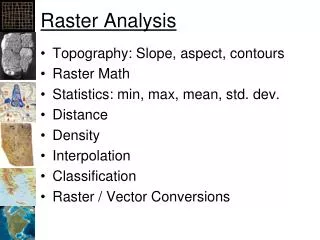
Raster Analysis • Raster math • Topography: Slope, aspect, contours • Reclassify • Raster / Vector Conversions • Statistics: min, max, mean, std. dev. • Local, Neighborhood, Zonal • Histograms • No Data / Null Value Issues • Future: • Distance (cost)
Jim’s Secrets for Rasters • Keep the overall size of the rasters below 200 Meg • Use “Resample” to convert to relatively small “IMG” files (or GRIDS) • Data Management Tools -> Raster -> Raster Processing -> Resample • Watch “Results” for errors • Geoprocessing -> “Results” • Use “Task Manager” when Arc crashes
Task Manager • Right Click on Menu Bar, “Start Task Manager” • “End Process” on all “Arc” processes
Raster Statistics • Local • Operate on one pixel in each raster • Neighborhood (or Focal) • Operate on a few pixels around each pixel • Zonal • Collection of regions • Region is a contiguous area of the same pixel values • Global • Operate on the “whole” raster
Local Stats • “Cell Statistics” computes stats on all the values for a pixel in a multi-band raster. • Example for “Sum”: Esri ArcGIS 10 Help
Neighborhood (or Focal) • Result=Operation on pixels nearby Columns Rows
Focal Statistics • Computes stats on pixels around an existing pixel • Example for Sum: Esri ArcGIS 10 Help
Zonal Statistics • Computes statistics for defined regions (features) • Tools: • Zonal Statistics: • Outputs a raster (not sure of the value) • Zonal Statistics as Table: • Outputs a table • Used to compute all kinds of valuable things: • Percent land cover • Percent impervious cover • Percent water below a certain depth • Etc.
Zonal Statistics Zone Layer Value layer Output layer (or table) Esri ArcGIS 10 Help
Conditional Operator • Con(<condition>,<true>,<false>) • Given a raster “condition”: • Puts the true value where true and false value where false Con!
Elevations over 3000 meters • Con("W100N40.DEM“>3000,0,1)
Convert Values to “No Data” SetNull("W100N40.DEM"==55537,"W100N40.DEM")
Rasters Draw as “Solid” Color • Click on “Type:” and select “Minimum-Maximum” • ArcGIS will compute statistics