Download
1 / 22
230 likes | 378 Vues
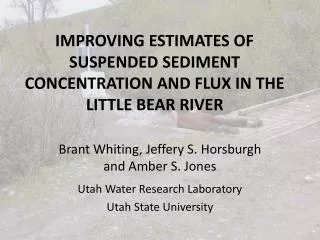
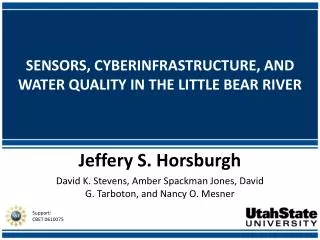
SENSORS, CYBERINFRASTRUCTURE, AND WATER QUALITY IN THE LITTLE BEAR RIVER. Jeffery S. Horsburgh David K. Stevens, Amber Spackman Jones, David G. Tarboton , and Nancy O. Mesner. Support: CBET 0610075. Objective.

E N D
SENSORS, CYBERINFRASTRUCTURE, AND WATER QUALITY IN THE LITTLE BEAR RIVER Jeffery S. Horsburgh David K. Stevens, Amber Spackman Jones, David G. Tarboton, and Nancy O. Mesner Support: CBET 0610075
Objective • Look at some of the monitoring work that we have done in the Little Bear River • How do the data we collect enable us to examine human, hydrologic, engineering, and ecological domains (or not)
Little Bear River Observatory Test Bed • Observing infrastructure for high frequency estimation of total phosphorus fluxes • High frequency surrogate measurements • Turbidity TSS or TP • Development and deployment of data management and publication cyberinfrastructure
Water Quality Issues • Nutrients • Eutrophication
Pollution Sources Urban Stormwater Runoff Wastewater Treatment Agriculture Industry
Understanding Water Quality • What are the sources of pollution and how much is coming from each source? • Transport pathways - How do pollutants reach the water bodies in the watershed? • Fate - what happens to the pollutants once they get into a water body? • How does water quality change in space and time? • In response to natural events (seasons, storms, snowmelt, etc.) • In response to human events (reservoir management, diversions, return flows, etc.)
The Space Challenge • How do water quality conditions vary throughout the watershed? • As a result of hydrologic features? • As a result of different land use? • As a result of management practices? • What processes (human and natural) drive the variability?
Little Bear River Watershed • 740 km2 (286 mi2) • 45 STORET (Utah DWQ) Monitoring Sites • 2 fall into the “data rich category” • Diversity of measured variables • Long period of record • Large number of samples
The Time Challenge • How and why does WQ change over time(hours - years) • Are WQ conditions getting better or worse? • What might happen in the future? • Climate change? • Land use change?
Little Bear River Sensor Network • 7 water quality and streamflow monitoring sites • Temperature • Dissolved Oxygen • pH • Specific Conductance • Turbidity • Water level/discharge • 4 weather stations • Air Temperature • Relative Humidity • Solar radiation • Precipitation • Barometric Pressure • Wind speed and direction • Soil moisture and temperature at 5 depths • Spread spectrum radio telemetry network Horsburgh, J. S., A. Spackman Jones, D. G. Tarboton, D. K. Stevens, N. O. Mesner (2009), A sensor network for high frequency estimation of water quality constituent fluxes using surrogates, Environmental Modelling & Software, 25(9), 1031-1044, doi:10.1016/j.envsoft.2009.10.012.
Sensor Network Central Observations Database Applications Observations Database (ODM) Base Station Computer Internet Radio Repeaters Internet ODM Streaming Data Loader Data discovery, visualization, and analysis through Internet enabled applications Remote Monitoring Sites
Cyberinfrastructure Horsburgh, J. S., D. G. Tarboton, M. Piasecki, D. R. Maidment, I. Zaslavsky, D. Valentine, and T. Whitenack (2009), An integrated system for publishing environmental observations data, Environmental Modeling and Software, 24, 879-888, doi:10.1016/j.envsoft.2009.01.002. Horsburgh, J. S., D. G. Tarboton, D. R. Maidment, and I. Zaslavsky (2009), Components of an integrated environmental observatory information system, Computers & Geosciences, (Accepted).
Overcoming the Time Challenge: Continuous Estimates of TSS and TP from Turbidity • Least squares regression for TSS • Regression with maximum likelihood estimation for TP (censored data) Spackman Jones, A., D. K. Stevens, J. S. Horsburgh, N. O. Mesner (2009), Surrogate measures for providing high frequency estimates of total suspended solids and total phosphorus concentrations, Journal of the American Water Resources Association, (Accepted). Little Bear River Near Paradise, UT
The Time Challenge: Effects of Sampling Frequency Spring 2006 Spackman Jones, A., N. O. Mesner, J. S. Horsburgh, R. J. Ryel, D. K. Stevens (2009), Impact of sampling frequency on annual load estimation of total phosphorus and total suspended solids, Journal of Hydrology, (In Review). Little Bear River near Paradise, UT
TP and TSS Loading 2006 • TSS and TP from turbidity using surrogate relationships • ~50-60% of the annual load occurs during one month of the year • Provides information about flow pathways Little Bear River Near Paradise, UT
The Time Challenge • Variability across water years Paradise site, water years 2006 and 2007
How do human activities affect WQ conditions? • Affects of reservoirs on water quality • Affects of agricultural diversions and return flows Little Bear River near Wellsville, UT
How do natural features and human activities affect WQ conditions? Spatial distribution of total suspended solids fluxes in the Little Bear River for 2008. The areas of the node markers are proportional to the total suspended solids fluxes, which are expressed in metric tons.
Linking Physical, Chemical, and Biological Aspects of Water Quality Different behavior based on where you are on the river
The Data Cube – “what-where-when” Time, T • Additional (Human) Dimensions • Reservoir release status • Diversion status • Irrigation practices • Local hydrology (soils, slope, aspect, moisture, etc.) • Conservation practices? • Other Opportunities • Capturing the results of all types of studies • For example: when the DO was 8 mg/L • the discharge was X • the stream velocity was X • the temperature was X • the algal biomass was X • N and P concentrations were X and Y • the solar radiation was X • upstream canal diversions were X • riparian shading was x • … “When” t 3/4/2007 A data value D 4.2 “Where” s “What” Paradise Space, S Vi Streamflow, cfs Variables, V
Discussion and Conclusions • It is difficult to understand or manage what we do not measure • We need to solve the space and time challenges • We need to collect data at a spatial and temporal frequency that is consistent with the processes we want to understand • AND we need data over times scales that will enable us to look at the longer term drivers • climate change • land use change • population growth • … • What should we be monitoring? • Flow volumes, pollutant concentrations, and mass loadings • Broadening the scope and going beyond just space and time • Including entire fields of study that we engineers don’t know as much about • Ecological data • Geomorphologic data • Management behavior (reservoir operations, agricultural water system management, water quality regulation) • Social science data (individual behaviors) • … • We need to design structures for representing and synthesizing diverse data – a Cyberinfrastructure challenge • How do we design a monitoring program for what we will need in the next 30 years instead of what we wish we would have had over the last 30 years?
Support: EAR 0622374 CBET 0610075 Questions? http://his.cuahsi.org/ CUAHSI HIS Sharing hydrologic data