Download
1 / 33
340 likes | 582 Vues
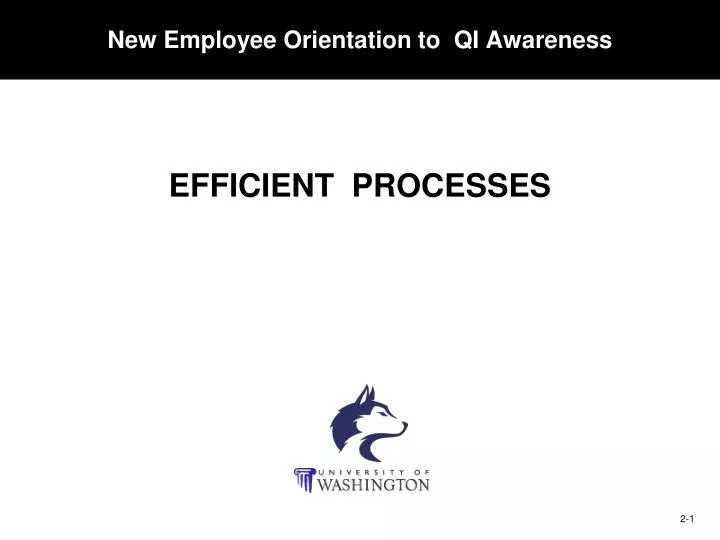
New Employee Orientation to QI Awareness. EFFICIENT PROCESSES. Quality Improvement Pyramid. Vision. Delighted Customers. Efficient Processes. Strategic Plans. Leaders Trustworthy Trusting of Others Approachable, Inspiring. Staff Trustworthy

E N D
New Employee Orientation to QI Awareness EFFICIENT PROCESSES
Quality Improvement Pyramid Vision Delighted Customers Efficient Processes Strategic Plans Leaders Trustworthy Trusting of Others Approachable, Inspiring Staff Trustworthy Trusting of Others Collaborative, Committed Quality Improvement System Trained Staff Recognition Data Analysis Customer Focus Empowered Staff Problem Solving Teamwork Quality Processes Measurement Systems
What is a process? Agenda DEFINITION EXAMPLES MEASUREMENT IMPROVEMENT SUMMARY DEFINITION EXAMPLES Processes MEASUREMENT Why and how we measure IMPROVEMENT Methodology for process improvement SUMMARY QI culture / environment
What is a Process? DEFINITION Value Added Tasks INPUT OUTPUT A resource that you will add value to: TRANSFORMING input to a desired output An input after you have added value • Materials • Goods • Supplies • Resources • Physical • Non-physical • Data • Event • Manufacturing • Service • Physical • Non-Physical • End product • Service • Performance • Physical • Non-Physical
Value Added Tasks INPUT OUTPUT Defining Value Added DEFINITION • 1) The customer is willing to pay for this activity.2) It must be done right the first time.3) The action must somehow change the product • or service in some manner.
Value Added Tasks INPUT OUTPUT Example of Value Added DEFINITION • Value-added activates (eg: refinery, shipping, service station) • Speculative purchases by investors • Exorbitant collusion profits among producers
Examples of Value Added DEFINITION Scenario: Value Added? Purchasing vegetables at your local market versus growing vegetables in your backyard Yes Buying take-out versus preparing food yourself Yes Watching Ichiro Suzuki play baseball Yes Watching Vincent Lau play baseball No Having you as a member of FM & SM Yes
Efficient & Effective Process DEFINITION Efficient is working without waste > Minimum time > Minimum effort > Minimum expense Effective means achieving the desired result > Hitting the target > Meeting customers’ needs
Efficient & Effective Process DEFINITION Without Waste (Efficient) With waste (Inefficient) Not achieving desired result (Ineffective) Achieving desired result (Effective)
Value Added Tasks INPUT OUTPUT Processes are dependent DEFINITION • Your process OUTPUT is often an INPUT for another process! • Process Partners Final / Collective Product Increasing incremental value
Example: Grant Process EXAMPLES How GCA Adds Value Setup New Budgets Apply Cash Monitor Cost Share / FEC Process Request to Transfer Expenditure Generate Invoices Collect Aged Receivables Negotiate Recharge Center Create Annual Reports Reconcile Awards & Expenditures Create Fiscal Reporting Statements Close Budgets Reconcile DHHS Records NEW BUDGET GRANT IS ACTIVE ACCOUNTING CLOSING BUDGET
Other Processes EXAMPLES Contracts for Goods & Services Bill & Collect Tuition Develop Financial Management Staff Develop & Negotiate Indirect Cost Rates Create & Market Communication Products Manage Financial Information Reporting Manage Grants Pay Bills Pay People Asset Management & Real Estate Services Disburse Aid Preservation/destruction of Records Project Management (Purchasing) (SFS) (FM) (MAA) (Publications) (Financial Accounting) (GCA) (Financial Services) (Payroll) (Real Estate) (SFS) (Records) (SM)
Value Added Tasks INPUT OUTPUT Exercise • Share among your table the processes that you are responsible for. • Identify your value-added tasks. • Discuss how your processes impact others at your table. • Share with the class.
Why Measure? MEASUREMENT Why Measure? Management System • Internal & external management system Accountability for university resources • Decreasing state funding • Strained economic climate Higher customer expectations Communicates to staff and campus our customer service level and how we provide value Must measure in order to benchmark (i.e. a point of reference, process improvement) FM, Treasury, Strategy Mgmt Management by facts Championed at executive level QI Initiative • Dedicated QI Leader / Coordinators • QI training for all staff QI resources • Employee development plan • Staff & leadership qualities • Process improvement & problem solving training • Newsletters • Recognition programs Balanced Score Card (Dashboard)
Similarities to an Automotive Dashboard MEASUREMENT What is the purpose of a dashboard?
DASHBOARD (BALANCED SCORE CARD) Customer (esp. important for Non-Profit) FM’s dedication to delight customers Financial Internal Process Learning & Growth Dashboard MEASUREMENT Long-term competitiveness is best gauged via a BALANCED perspective. For example, financial statements will not display intangible assets: cycle-time, knowledge management, customer satisfaction, etc.
Unit Balanced Scorecard Unit Balanced Scorecard Unit Balanced Scorecard Department Dashboard Unit Balanced Scorecard Unit Balanced Scorecard Customer Financial Internal Business Process Learning & Growth Dashboard is Managing by Facts (Example Financial Management) MEASUREMENT
Communicate with campus & ourselves Better understand processes & improve Work with process partners Make changes Utilizing Operational Dashboards MEASUREMENT
TQM A management style that promotes an organization’s culture and attitude to continuously satisfy the needs of their customers. LEAN A philosophy and practice to focus on eliminating all forms of waste in a process. http://f2.washington.edu/lean Question: LEAN & QI ? LEAN is QI on steroids (just do it, 30-60-90 day check-ins, waste focus from customer view, wing to wing) VARIANCE ANALYSIS A philosophy, practice, and measurement system to reduce variance (eg. six sigma, statistical process control charts) DEMING CYCLE- PDCA A methodology to continuously improve a process by understanding the needs of the customer. QI Principles that Reduce Variability IMPROVEMENT
W. Edwards Deming propose: Analyze and measure for variations that cause deviation from customer requirements Built around a continuous feedback loop to improve the process PDCA Cycle for Process Improvement IMPROVEMENT
Value Added Tasks INPUT OUTPUT Coin Exercise • Ground rules provided by instructor. • Three rounds with equal allotted time. • Debrief after each round.
PDCA Case Study: New Budget Setup IMPROVEMENT FIRST ATTEMPT • July 2003 retreat • Identified New Budget Setup as critical customer concern • Brainstormed alternatives PLAN • New Accounts reprioritized workload • Measure volume of workload DO • Monitored progress via dashboard • Early success only CHECK ACT • Inconsistent performance suggest we need further improvements
PDCA Case Study: New Budget Setup IMPROVEMENT
PDCA Case Study: New Budget Setup IMPROVEMENT FIRST ATTEMPT SECOND ATTEMPT • July 2003 retreat • Identified New Budget Setup as critical customer concern • Brainstormed alternatives • December 2003 • Reviewed why “First-Attempt” not successful • Identified inconsistent interpretation of “priorities” PLAN • New Accounts reprioritized workload • Measure volume of workload • Inventory new account processes and workload • Defined setting up new budget as number one priority above all else DO • Monitored progress via dashboard • Early success only • Monitored progress via dashboard • Success evident in February 2004 • Also implemented email notification CHECK ACT • Inconsistent performance suggest we need further improvements • New process now widely adopted • New Accounts now consistently exceeds ambitious 1 day turn-around (i.e. same-day turn around).
PDCA Case Study: New Budget Setup IMPROVEMENT
Segmenting Data IMPROVEMENT
Data Variability IMPROVEMENT
Complex (Judgment) Process Measure IMPROVEMENT
Industry Benchmark IMPROVEMENT Target = 2.25 Average cost per paycheck for displayed California schools
Dashboard IMPROVEMENT
Questions IMPROVEMENT How to apply quality improvement to everyday process? • Are Targets met? What is the problem? • Why not? Baseline/benchmark/trend. • Root cause analysis. • Pareto analysis. PDCA • Check your data (manage by facts) What happens when a process goes away? Do you still measure? • Has the process evolved to something else (e.g. manual transactions converting to eCommerce) • When do you measure a process? • dashboard = core processes • scorecard = strategy/change • measure if you want to process improve)
Setting Targets IMPROVEMENT Four ways to set targets: Customer Expectations Compliance Law requirement Industry Benchmark Best Practices Stretch
Value Added Tasks INPUT OUTPUT Applying PDCA SUMMARY How does your department and your process add value to FM and the customer?